Article Text

Abstract
Background The NLRP3-inflammasome, implicated in the pathogenesis of several inflammatory disorders, has been analysed in rheumatoid arthritis (RA).
Methods Relative gene expression of NLRP3-inflammasome components was characterised in PBMCs of 29 patients receiving infliximab. A total of 1278 Caucasian patients with RA from the Biologics in Rheumatoid Arthritis Genetics and Genomics Study Syndicate (BRAGGSS) cohort receiving tumour necrosis factor (TNF) antagonists (infliximab, adalimumab and etanercept) were genotyped for 34 single nucleotide polymorphisms (SNPs), spanning the genes NLRP3, MEFV and CARD8. Regression analyses were performed to test for association between genotype and susceptibility and treatment response (disease activity score across 28 joints (DAS28) and EULAR improvement criteria) at 6 months, with secondary expression quantitative trait loci (eQTL) analyses.
Results At baseline, gene expression of ASC, MEFV, NLRP3-FL, NLRP3-SL and CASP1 were significantly higher compared with controls whereas CARD8 was lower in the patients. Caspase-1 and interleukin-18 levels were significantly raised in patients with RA. SNPs in NLRP3 showed association with RA susceptibility and EULAR response to anti-TNF in the BRAGGSS cohort, and in monocytes but not B cells, in eQTL analysis of 283 healthy controls. CARD8 SNPs were associated with RA susceptibility and DAS28 improvement in response to anti-TNF and eQTL effects in monocytes and B cells.
Conclusions This study found evidence of modulation of the NLRP3-inflammasome in patients with RA prior to receiving infliximab and some evidence of association for SNPs at NLRP3 and CARD8 loci with RA susceptibility and response to anti-TNF. The SNPs associated with susceptibility/response are not the main eQTL variants for either locus, and the associations with treatment response require replication in an independent cohort.
- Anti-TNF
- Inflammation
- Rheumatoid Arthritis
- Treatment
Statistics from Altmetric.com
Introduction
The pathogenesis of rheumatoid arthritis (RA) involves aberrant innate and adaptive immune responses.1 Several cytokines have been implicated in RA pathogenesis and persistence. In particular, tumour necrosis factor (TNF) and interleukin-1β (IL-1β), secreted by monocytes/macrophages help to induce and perpetuate inflammatory processes in affected joints.2 ,3 The NLRP3-inflammasome (also known as the caspase-1 inflammasome) is an intracellular complex involved in proteolytic activation of IL-1β and IL-18 (see online supplementary figure S1). Inflammasome activation, by stimuli such as K+ flux, adenosine triphosphate (ATP) and/or reactive oxygen species4 ,5 results in the caspase-1 mediated cleavage of pro-IL-1β into biologically active IL-1β. A role for the NLRP3-inflammasome in recurrent and chronic inflammation was initially described in a group of rare autoinflammatory conditions, termed cryopyrin-associated periodic syndromes (CAPS).6 ,7 Subsequently, the NLRP3-inflammasome has been implicated in many common diseases, including cancer, gout and diabetes.8 There are at least five different protein components integral to this complex, including NLRP3 itself, caspase recruitment domain-containing protein 8 (CARD8), pyrin, apoptosis-associated speck-like protein containing CARD (ASC) and pro-caspase-1.9 ,10 The NLRP3-inflammasome senses damage-associated molecular pathogens and subsequent secretion of IL-1β and IL-18 may be destructive to tissues11 and play an important role in bone resorption and cartilage destruction in RA.12 In the resting state, NLRP3 expression in innate immune cells such as monocytes, splenic neutrophils and dendritic cells is low and activation requires transcription of NLRP3, induced by signals such as lipopolysaccharide, TNF and IL-1β.13 NLRP3 expression is not induced in lymphoid subsets and eosinophils.13 A number of alternatively spliced transcript variants encoding distinct isoforms have been identified for the NLRP3 gene. The short isoform, encoded by exons 1–3, is referred to as NLRP3-SL14 and the full length isoform (NLRP3-FL) is encoded by exons 1–9.14
The role of NLRP3 in CAPS is established, with mutations in the NACHT (NAIP, CIITA, HET-E and TP1) domain leading to excessive IL-1β release.
The ultimate goal in treating RA is to induce remission or very low disease activity. Biological therapies have improved the outcome for many patients with RA, with marked clinical and radiographic benefit.15 However, the incidence of remission in RA, as defined by DAS28 (disease activity score across 28 joints) <2.6,16 is less than 50% in most series,17 ,18 with about a third of patients being defined as non-responders, and two-thirds as moderate or good responders, when the European League Against Rheumatism (EULAR) criteria are applied.19 Furthermore, over 40% of patients show impaired response to all therapies20 ,21 and if EULAR poor and moderate responders are combined the majority of patients have impaired response. Currently, the mechanisms of response and non-response to biologics are unclear, and there remains a pressing need for reliable biomarkers to achieve optimal therapeutic response at earlier stages of RA.22
A number of pharmacogenetic studies have reported single nucleotide polymorphisms (SNPs) in various genes associated with good response/resistance to biologics therapies in patients with RA.23–26 Genetic variation in two proteins, namely NLRP3 and CARD8 of the NLRP3-inflammasome complex, have been reported to influence susceptibility and severity of RA.27 Two variants in the genes encoding NLRP3 and CARD8 were investigated in 174 Swedish patients with early RA; these were p.Q705K, a non-synonymous coding SNP within NLRP3 (c.2107C→A, rs35829419) and p.C10X, a SNP in CARD8 (c.30T→A, rs2043211) which generates a premature stop codon (p.C10X).28 The combination of p.Q705K/ p.C10X in NLRP3/CARD8 (−/−, denoting presence of the two minor alleles), as compared with NLRP3/CARD8 +/+, was significantly more common among patients with RA than controls.27 In a later study the p.C10X CARD8 variant was associated with inflammatory activity in early RA29 and significantly over-represented among patients who received anti-TNF therapy.
There is considerable evidence that the innate immune system is persistently activated in RA.30 The NLRP3-inflammasome responds to hypoxia, which is an essential feature of the inflammatory process in active RA and also a crucial element for inflammasome activation. We therefore tested the hypothesis that the NLRP3-inflammasome is activated in patients with RA prior to receiving biologics and also that this activation could be modulated in patients receiving infliximab therapy. We characterised the expression of six NLRP3-inflammasome components (ASC, pyrin, NLRP3-FL, NLRP3-SL, CARD8 and caspase-1, encoded by ASC, MEFV, NLRP3, CARD8 and CASP1) in peripheral blood mononuclear cells (PBMCs) of patients with active RA undergoing treatment with infliximab. We also investigated whether genetic variation within genes encoding constituent proteins of the NLRP3-inflammasome (NLRP3, MEFV and CARD8,) influenced response to anti-TNF therapy in the Biologics in Rheumatoid Arthritis Genetics and Genomics Study Syndicate (BRAGGSS) cohort.24 We selected these genes as disease associations had already been reported for each of them in relevant inflammatory conditions.31 ,32
Methods
Patient cohort for study of NLRP3-inflammasome components
Peripheral blood samples were obtained from patients that had been diagnosed with RA (n=29), according to the 1987 ACR criteria,33 and selected for infliximab therapy due to high disease activity (DAS28≥5.1), despite conventional DMARD treatment. Blood was obtained prior to starting therapy (baseline), and again at week 14. The DAS28 response at week 14 was recorded according to EULAR criteria, and also as the change from baseline. Blood samples were also obtained from 22 age-matched and gender-matched healthy controls (HCs) (16F, 6M, mean SD age 55·27 (±8.94) years in HC; 22F, 7M, mean SD age 58·45 (±15.9) years for patients). Total RNA was extracted from PBMCs and prepared for quantitative real-time PCR analysis: ASC, pyrin, NLRP3 (NLRP3-FL and NLRP3-SL), CARD8 and caspase-1 transcripts were assessed relative to the housekeeping gene, hypoxanthine–guanine phosphoribosyltransferase (HPRT) (see online supplementary table S1).
Caspase-1 and IL-18 measurements
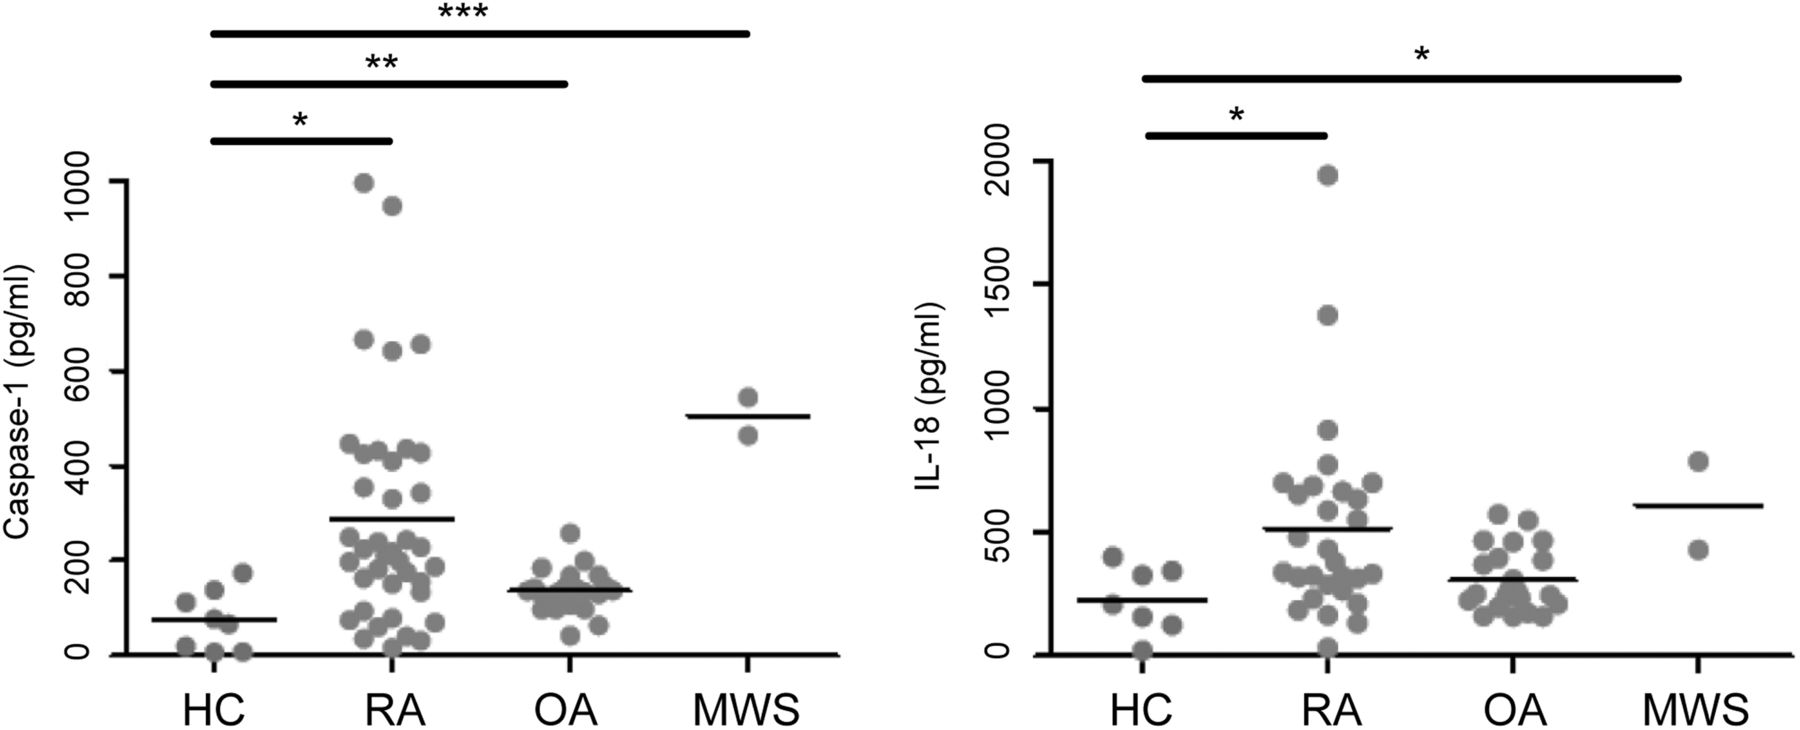
Caspase-1 and IL-18 levels were determined, using ELISA assays (Quantikine caspase-1 immunoassay, R&D Systems and Human IL-18 ELISA kit, MBL International) in sera from HCs (n=8) and compared with patients with RA (n=39) as well as patients with osteoarthritis (n=22) and Muckle-Wells syndrome (n=2), a form of CAPS.
BRAGGSS cohort for genotyping study
For the genotyping part of the study, a total of 1278 UK Caucasian patients with RA receiving anti-TNF therapy (infliximab, n=501, adalimumab, n=510 and etanercept, n=267) were recruited into the BRAGGSS study, as previously described.24 Ethical committee approval was granted by the UK Central Office of Research Ethics Committee (RA cohort: 01/023, HC: 04/Q1206/107, BRAGGSS: 04/Q1403/37).
Previously reported variants in three genes (NLRP3, MEFV and CARD8) were selected for genotyping, in addition to pairwise-tag SNPs identified using the CEPH/CEU HapMap dataset (Phase II, release 23a/ March08) and Haploview software (minor allele frequency (MAF) >0.1, Hardy-Weinberg equilibrium p value>0.05).34 The total number of SNPs was reduced by prioritising markers based on their potential for modulating parent gene expression by analysing expression quantitative trait loci (eQTL) data from two publicly available resources (SNPexp v1.235 and Sanger Genevar).36 A total of 37 SNPs were successfully genotyped with a call rate of >90%, using Sequenom's MassARRAY iPLEX system (Sequenom, Cambridge, UK), giving (71%, 66% and 58% gene coverage for NLRP3, MEFV and CARD8, respectively, data not shown). Three assays failed quality control due to Hardy-Weinberg equilibrium <0.001 (n=2) or MAF <0.005 (n=1) and were removed from the data set. The assay for the aforementioned rs2043211 SNP in CARD8 failed to convert to an usable assay, but was in moderate linkage disequilibrium (LD) (r2=0.82) with rs16981853, which was successfully genotyped.
Control data were available from samples genotyped on the Illumina HumanHap 1.2 million array by the Wellcome Trust Case Control Consortium (WTCCC).37 A total of 5200 birth cohort (1958) and blood donors’ samples passed the above quality control measures and were available for analysis. Of the 34 SNPs above, the following were not on the array or did not pass quality control in the WTCCC data: rs7512998, rs10754555, rs35829419, rs6672995, rs224217, rs10418239, rs11881179, rs16981832, rs4802449, rs16981864, rs12460147 and rs17589988. This left 22 of the 34 SNPs available for the susceptibility analysis.
eQTL analyses
Gene expression on the Illumina HumanHT-12v4 BeadChip array and genome-wide SNP data on the Illumina Human OmniExpress-12v1.0 BeadChip array were available on 283 healthy European individuals.38 The CARD8 and NLRP3 regions were imputed in the genotyped data after excluding SNPs with MAF <0.03, Hardy-Weinberg equilibrium p value<0.0001 or missingness >3%, with the 1000 Genomes March 2012 reference panel using IMPUTEv2.39 Only SNPs with an IMPUTE info score of >0.8 were used in the analysis.
Statistical analyses
Statistical analyses were performed using STATA software V.10 (StataCorp, College Station, TX, USA). Mann-Whitney tests were used to compare baseline expression levels between patients with RA and controls. Linear regression was performed of change in DAS28 on baseline expression levels and on change in expression levels over 14 weeks. A trend test was used to compare genotype frequencies between patients with RA with WTCCC controls. As previously described,24 linear regression was used to test for association between genotype and treatment response at 6 months, using improvement in DAS28 with correction for baseline DAS28, and with and without correction for HAQ (Health Assessment Questionnaire, four categories), gender, concomitant disease-modifying antirheumatic drugs (DMARDs) (yes/no) and RF status (ever positive/ negative). Stratified analyses were performed to investigate association with individual therapies (etanercept and infliximab and adalimumab combined). In a secondary analysis, EULAR categorisation (good, moderate or no response) was used as the outcome. The risk ratio for good response compared with non-response (omitting the moderate group) was estimated, using Poisson regression models with a robust error variance, adjusting for the same variables as before. This was repeated by grouping moderate and good response and comparing with non-response. Linear regression was used to compare baseline expression levels with genotype for each SNP assuming a dominant model in the eQTL analyses.
Power calculations for the genetic study were performed using Quanto.40 For a SNP with a MAF of 25%, we had 31%, 83% and 99% power to detect a change in DAS28 of 0.1, 0.2 and 0.3, respectively. We report results significant at the nominal 5% significance level. However, 34 SNPs were analysed in relation to improvement in DAS28 and EULAR response (contrasting responders and good responders with non-responders). Even given that many of these tests are not independent, since outcomes are related and some SNPs are in LD, a significance level of 0.001 would be more appropriate. This study is well powered to detect a modest effect on outcome at this level: there is 95% power to detect the effect of a variant on improvement in DAS28 that explains 2% of the overall improvement (eg, a SNP with MAF 0.4 with a regression coefficient of 0.3 from an additive genetic model, or a rarer SNP with a larger effect).
As the rs4925659 and rs10925026 variants in NLRP3 and rs11672725 SNP in CARD8 showed some evidence of association with EULAR response in the BRAGGSS cohort, we specifically genotyped these variants in the 29 patients who received infliximab to look for correlations between expression levels and genotype. We also genotyped these patients for rs2043211 in CARD8, due to its reported associations with RA27 ,29 and inflammatory bowel disease (IBD).32 Direct sequencing was used to genotype these markers (see online supplementary table S2).
Results
Baseline characteristics in patients with RA receiving infliximab
At baseline, the gene expression levels in PBMCs of patients with RA were higher compared with controls for ASC, CASP1, MEFV, NLRP3-FL and NLRP3-SL, (ratio of median expression levels (p values) of 1.52 (0.015), 2.13 (0.0032), 1.82 (0.0062), 3.26 (0.0026) and 1.71 (0.000016), respectively) and lower for CARD8 (0.71 (0.022), see figure 1). Patients with lower baseline NLRP3-SL levels showed improved response to treatment measured by DAS28 at 14 weeks (p=0.016), with a more borderline association for lower baseline pyrin levels (p=0.050, data not shown). No changes in expression levels over the first 14 weeks were associated with response to treatment. As a number of outliers were observed for expression of the different genes studied we therefore correlated DAS28 scores with expression levels among the outliers but no significant associations were found.

Expression of inflammasome components in PBMCs of patients with rheumatoid arthritis (RA) (cross) and healthy controls (open circle), relative to hypoxanthine–guanine phosphoribosyltransferase (HPRT). p Values for association between expression and disease state are shown.
Effects of genotype on changes in DAS28 and EULAR response
The full demographic characteristics for the 1278 genotyped patients with RA from the BRAGGSS cohort were comparable with previous reports on this cohort.25 Anti-citrullinated protein antibodies (ACPA) positivity was also associated with response, but this was highly correlated with RF positivity and only available on 1000 patients and was therefore not included in subsequent analyses.
We initially analysed the variants in NLRP3, MEFV and CARD8 for association with RA susceptibility with population data from 5200 controls collected by the WTCCC.37 One SNP, rs10159239 in NLRP3 was associated with RA susceptibility (OR and 95% CI for the G allele 0.88 (0.81 to 0.96), p=0.0036). Furthermore, two rare variants in CARD8 (rs16981845 and rs10416565), that were in strong LD, were associated with RA susceptibility (p=0.0066 and p=0.0083). No SNPs in NLRP3, MEFV or CARD8 were associated with baseline DAS28 (p>0.05).
Multiple linear regression demonstrated that only rs10403848 in CARD8 was associated with change in DAS28 at a nominal 5% significance level in the total cohort (p=0.02, table 1). Improved EULAR response was associated with the rs10403848A allele (table 2), but this was not statistically significant.
Linear regression of improvement in DAS28 on SNPs and risk ratios for EULAR response adjusted for baseline DAS28, gender, concurrent DMARD therapy, HAQ erosions and RF status
SNPs in NLRP3 and CARD8 associated with improvement in DAS28 and EULAR response.
This variant was not in LD with the two CARD8 rare variants associated with RA susceptibility (rs16981845 and rs10416565, r2=0.04 for each variant, see online supplementary table S3). No variants were associated with change in DAS28 when the analyses were stratified by either etanercept or monoclonal antibody (mAb: infliximab and adalimumab) treatment. No significant associations were found for SNPs at the MEFV locus.
In the analyses of EULAR criteria (table 1), two variants in NLRP3 in weak LD with each other (rs4925659 and rs10925026, r2=0.36, see online supplementary table S3) showed a relationship with EULAR response at the nominal 5% level (p=0.006 and p=0.02, respectively). This rs10925026 variant was also associated with good response versus no response, as was rs4925648 also in NLRP3 (p=0.03 and p=0.04, respectively). Improved response was associated with the A allele for rs4925659 and non-response was associated with the C allele for rs10925026 (table 2). The aforementioned RA susceptibility variant (rs10159239) was in modest LD with rs4925659 (r2=0.50), but not rs10925026 or rs4925648 (r2=0.01 for both variants, see online supplementary table S3). Baseline expressions of NLRP3-SL and NLRP3-FL were not associated with carriage of the minor allele of either rs10925026 or rs4925659 when genotyped in PBMCs of the 29 patients studied who received infliximab (figure 2, p>0.15 for each comparison).

Expression of NLRP3 and CARD8 in PBMC of patients at baseline for carriage (circle) or non-carriage (cross) of minor allele. Minor alleles are as follows: rs11672725-T, rs2043211-A, rs1092502-C, rs4925659-A).
Furthermore, one SNP (rs11672725) in CARD8 was nominally associated with EULAR response (p=0.032, see table 1), with improved response for those carrying the T allele (table 2). This variant was not in LD with the rs10403848 variant in CARD8 that was associated with change in DAS28 (r2=0.06). When genotyped in the PBMCs of the 29 patients studied, carriage of the rs11672725-T allele (green) was associated with lower baseline CARD8 levels (p=0.011, figure 2). However, carriage of the rs2043211-A variant was not associated with baseline CARD8 levels.
Caspase-1 and IL-18 levels
Patients with RA and Muckle-Wells syndrome had significantly higher levels of caspase-1 than HCs (p=0.016 and p=0.0001, respectively, see figure 3). IL-18 release in patients with RA was also significantly raised in comparison with HCs (p=0.034, figure 3).

Comparison of Caspase-1 and interleukin (IL)-18 levels in serum of patients with rheumatoid arthritis (RA) (n=39), osteoarthritis (OA) (n=22), Muckle-Wells syndrome (MWS) (n=2) and healthy controls (HCs) (n=8). A Kruskal-Wallis test with Dunn's multiple comparison correction was carried out to analyse significant differences between the groups (*p<0.05, **p<0.01, ***p<0.001).
eQTL analyses
Secondary eQTL analyses of the 283 healthy individuals demonstrated a relatively weak association signal between SNPs in the NLRP3 region in monocytes, but not in B cells, and the probe ILMN-1696933 (Illumina), the strongest being rs56083970, p=4.5×10⁻⁵ (figure 4A). The SNPs rs4925659 and rs10925026 were also associated with this probe (p=0.0010 and p=0.0039 in monocytes, respectively, see online supplementary table S4). However, rs56083970 was in strong LD with rs12565738 (r2=0.98), which was directly genotyped in the BRAGGSS cohort and not associated with response, suggesting the observed association may not be mediated by this eQTL. Several SNPs in the CARD8 region are clearly identifiable as eQTL SNPs with stronger associations in monocytes than B cells (figure 4B). The SNP rs11672725 demonstrated an association with the CARD8 probe ILMN-2192281 (p=0.00057 in monocytes, see online supplementary table S4). However, other SNPs in the region were much more strongly associated, the highest being rs56012561, p=8.9×10–48 in monocytes, which was in modest LD with rs10500299 and rs2043211/rs16981853 (r2=0.63 and r2=0.68, respectively), neither of which were associated with response.

Expression quantitative trait loci (eQTL) analysis of genotype and expression probe correlation for NLRP3 and CARD8 in B cells and monocytes. (A) NLRP3 expression probe ILMN-1696933 correlation with SNP genotype markers ± 500kb from the gene Coding Sequence (CDS) boundaries. A weak association signal was demonstrated in monocytes, but not in B cells, for NLRP3 expression. Two other NLRP3 expression probes (ILMN_1712026 and ILMN_2310896) showed no evidence of association with SNPs in the region. (B) CARD8 expression probe ILMN_2192281 correlation with SNP genotype markers ± 500kb from the gene CDS region. Several markers in the CARD8 region are identifiable as eQTL SNPs, with stronger association in monocytes than in B cells.
Discussion
This study was undertaken to examine the contribution of NLRP3-inflammasome components to active RA and the effects of anti-TNF therapy. NLRP3-inflammasome-related gene expression (ASC, MEFV, NLRP3-FL, NLRP3-SL and CASP1) in PBMCs were upregulated and CARD8 was lower in active RA prior to receiving TNF blockade, but were not significantly modulated by infliximab therapy at 14 weeks.
This upregulation of NLRP3-inflammasome-related transcripts and downregulation of CARD8 in patients with active RA is likely to reflect increased activity of the inflammasome. The assembly of the NLRP3-inflammasome involves homotypic interactions of pyrin, NLRP3 and the adapter protein, ASC, through their respective N-terminal PYD (PYRIN domain) domains.5 ASC oligomerises via its CARD with pro-caspase-1 to mediate the proteolytic activation of caspase-1 and IL-1β release (see online supplementary figure S1). However, there is limited understanding of the regulatory mechanisms of NLRP3-inflammasome activation and, in particular, the negative feedback mechanisms which limit the extent of IL-1β secretion, and the roles of individual proteins in this process.41
Our genotyping data show nominal associations between genotype and disease susceptibility and response to anti-TNF therapy, suggesting that genetic variation in this complex may influence response to anti-TNF therapy in RA, which corroborates some of the previously reported data from the Swedish studies.27 ,28 None of the observed associations with treatment response met a significance level of 0.001. The study is well powered to detect effects of reasonable size at this level, so the fact that no associations reach this level of significance suggests that the effect of any individual SNP must be small. The observed effect sizes were all small, and a larger study would be required to demonstrate their significance at a stringent significance level. For example, the only SNP showing a nominally significant effect on improvement in DAS28 (rs10403848 in CARD8) had a regression coefficient of around 0.2 and a MAF of 0.2, which would explain about 0.6% of the variance in change in DAS28. The study had 28% power to detect an effect of this size at a significance level of 0.001. Similarly the study has low power to detect effects on EULAR response of the sizes observed.
Our analyses identified eQTL SNPs at the NLRP3 and CARD8 loci.38 However, the SNPs associated with susceptibility/response appear to be separate to the eQTL SNPs in the NLRP3 and CARD8 loci, with the strongest eQTL variants, or variants in strong LD with these, not displaying association with disease susceptibility or response. Likewise, carriage of the rs2043211-A variant, which encodes a premature stop codon, was not associated with baseline CARD8 levels. Further work is therefore required to confirm these associations and unravel the functional variants that are driving the observed association with RA and response to TNF blockade at these loci. It is notable that SNPs within the NLRP3 and CARD8 loci have been associated with RA in Swedish patients, but studies of French and Tunisian patients with RA have shown no such associations.42 There is a marked geographical variation in the prevalence of some diseases involving components of the NLRP3-inflammasome; familial Mediterranean fever, due to mutated pyrin, is much more common in populations from the Middle East.
In conclusion, we have found evidence of modulation of the NLRP3-inflammasome at the transcriptional level in PBMC of patients with RA prior to receiving infliximab therapy; however, expression levels of these inflammasome components were not significantly altered after 14 weeks of therapy in either responders or non-responders to infliximab. We have also shown that genetic variation at SNPs within two different components of the NLRP3-inflammasome (NLRP3 and CARD8) influence disease susceptibility and response to anti-TNF therapy in patients with RA. The SNP associations with treatment response require replication in a large independent cohort of patients with RA. This study offers further evidence of the role of inflammasomes in autoimmunity43 and future research directions.
Acknowledgments
We thank the NIHR-Leeds Musculoskeletal Biomedical Research Unit and NIHR-Oxford Biomedical Research Centre that supported this work. Seiko Makino, Ben Fairfax and Julian Knight (University of Oxford Wellcome Trust Centre for Human Genetics/ National Institute for Health Research Oxford Biomedical Research Centre) provided us with access to SNP genotyping data for eQTL mapping using the previously reported healthy volunteer cohort of primary B cells and monocytes.38
References
Supplementary materials
Supplementary Data
This web only file has been produced by the BMJ Publishing Group from an electronic file supplied by the author(s) and has not been edited for content.
Files in this Data Supplement:
- Data supplement 1 - Online supplement
Footnotes
Handling editor Tore K Kvien
RJM, JIR and MB contributed equally.
-
Correction notice The article has been corrected twice since it was published Online First. Affiliations 1 and 2, and figure 4 legend have been updated.
-
Collaborators See online supplementary appendix 1 for list of members.
-
Contributors RJM, JIR, JHB, AWM and MFM were involved in design of the study, BRAGGSS, KH, AB, SS and PE contributed to the recruitment of patients, with collection of patient samples and clinical data, RJM, JIR, MB, CW, SE and SMC undertook the laboratory work, SMC designed the quantitative real-time PCR protocols, JCT and JHB performed data analysis, all authors contributed to the interpretation of the data and also preparation of the manuscript. Writing of the final manuscript was by JIR, JCT, JHB, AWM and MFM.
-
Funding Arthritis Research UK (grant number17 552), Sir Jules Thorn ‘Seed Corn’ Fund (grant number RSC91), and the European Union that funded Masterswitch, a FP7-integrated project (grant number 223 404).
-
Competing interests None.
-
Patient consent Obtained.
-
Ethics approval UK Central Office of Research Ethics Committee (RA cohort: 01/023, HC: 04/Q1206/107, BRAGGSS: 04/Q1403/37).
-
Provenance and peer review Not commissioned; externally peer reviewed.