Article Text

Abstract
Aims: (1) To determine the extent to which tonsil size contributes to the severity of obstructive sleep apnoea (OSA) in children; and (2) to assess the use of tonsillar-pharyngeal (TP) ratio in differentiating patients with different severity of OSA.
Methods: Lateral neck radiograph was performed on 35 children referred consecutively to a university paediatric chest clinic for suspected OSA secondary to tonsillar hypertrophy. The tonsil size was determined by measuring the TP ratio on the radiographs. The severity of OSA was assessed by overnight polysomnography.
Results: A total of 24 boys and 11 girls (median age 6.2 years) were studied. All presented with symptoms of OSA, and tonsillar hypertrophy was detected on clinical examination. The median apnoea–hypopnoea index (AHI) was 16.93 (interquartile range: 8.41 to 28.29). The median TP ratio was 0.76 (interquartile range: 0.65 to 0.80). AHI was positively correlated with the TP ratio. The clinical tonsil size did not correlate with the AHI or the TP ratio. Using a TP ratio of 0.479, the sensitivity and specificity in predicting cases with moderate/severe OSA (AHI >10) were 95.8% and 81.8% respectively, while the positive and negative predictive values were 92.0% and 90.0% respectively.
Conclusions: Results show that in a population of children with OSA, tonsillar hypertrophy as assessed by lateral neck radiograph correlates positively with the severity of obstructive sleep apnoea. The TP ratio has high sensitivity and specificity in predicting those with moderate/severe disease and this feature may be used as a clinical screening method in prioritising patients with OSA for further assessment.
- obstructive sleep apnoea
- tonsillar hypertrophy
- lateral neck radiograph
- AHI, apnoea–hyperpnoea index
- OSA, obstructive sleep apnoea
- OSAS, obstructive sleep apnoea syndrome
- PSG, polysomnography
- ROC, receiver operating charactristic
- TP, tonsillar-pharyngeal
Statistics from Altmetric.com
- AHI, apnoea–hyperpnoea index
- OSA, obstructive sleep apnoea
- OSAS, obstructive sleep apnoea syndrome
- PSG, polysomnography
- ROC, receiver operating charactristic
- TP, tonsillar-pharyngeal
Obstructive sleep apnoea syndrome (OSAS) in children is characterised by recurrent events of partial or complete upper airway obstruction during sleep, resulting in disruption of normal ventilation and sleep patterns.1 The condition is increasingly being recognised and studies have found the prevalence to be around 2–4% among the paediatric population.2,3 Many causes have been found to lead to OSAS, but adenotonsillar hypertrophy remains the most common.4,5
Children with OSAS have larger tonsils on clinical inspection than do children without OSAS,6 and adenotonsillectomy has resulted in improvement in symptoms, polysomnographic readings,7 and remission of serious sequelae such as cor pulmonale.8 Previous studies, however, have failed to establish any relation between tonsil size assessed by direct inspection and severity of OSAS in children.9–11
The gold standard for the diagnosis of OSAS is polysomnography (PSG) performed in a sleep laboratory. It is an expensive system to operate and very time and labour intensive. In many units, limited access to equipment resources has resulted in long waiting times for PSG assessments. Various less resource demanding screening methods have been proposed, including home video recording, nap study, and pulse oximetry. Although these methods were found to be sensitive in detecting for OSAS, they were unable to differentiate between the varying degrees of severity of the condition.12
In this study, we measured the tonsillar-pharyngeal (TP) ratio on standard lateral neck radiograph and performed overnight PSG in 35 children with suspected OSAS. The relation between the two modalities of investigation was examined. The feasibility of using TP ratio in differentiating paediatric patients with different severities of OSAS was also assessed.
METHODS
Subjects
A total of 35 consecutive patients, referred to our paediatric chest clinic because of suspected OSAS, were recruited in the study. Children with a known syndromic diagnosis, chronic lung disease, or neurological or craniofacial abnormalities were excluded. Children enrolled underwent physical examination, standard lateral neck radiograph, and overnight polysomnography (PSG) after informed consent was obtained from the parents.
Method
The clinical history of each child was obtained from the parent; the following information related to obstructive sleep apnoea (OSA) was obtained using a standardised questionnaire: (1) night-time symptoms, which included loudness and frequency of snoring, difficulty in breathing, observed apnoea during sleep, necessity for parents to shake the child to breathe, restless sleep, varying sleep posture, enuresis, and night sweating; (2) daytime symptoms which included excessive daytime sleepiness, behavioural problems, morning headache, and mouth breathing. The loudness of snoring was assessed as just audible, clearly heard in the same room, clearly heard outside the room, and clearly heard in another room. The frequency of snoring was defined as never, rarely, 1–4 times a month, more than once a week and every night. Other symptoms were assessed as being present or absent.
A complete physical examination was carried out on each child to assess his or her physical state, especially growth parameters (height and weight), tonsil size, and signs of pulmonary hypertension or cor pulmonale. Tonsil size was graded using a point scale as follows: 0, no enlargement; 1, slight enlargement with the transverse air slit more than half the diameter of the palatal airway; 2, moderate enlargement with the air slit about half the palatal airway diameter; 3, profound enlargement with the air slit less than half the airway diameter; 4, total obstruction with tonsils touching each other at the midline.13 Chest radiograph and electrocardiogram were performed on each child for evidence of cor pulmonale.
An overnight polysomnography (PSG) was performed on each child using a 16 channel recorder (Oxford Medilog MPA-S, Oxford Instruments Ltd, Oxford, UK). In each PSG study the stage of sleep was assessed by electroencephalogram, bilateral electro-oculogram, and submental electromyogram; chest wall and abdominal movements were measured by respiratory impendence plethysmography; airflow through the nose was measured with a thermister; oxygen saturation was measured by pulse oximetry; and body motions were recorded by a body position sensor.
Sleep stage was scored by trained personnel and the standard criteria were followed.14 An obstructive event was defined as cessation of airflow with increase in irregular respiratory and abdominal movement for more than two consecutive breaths. Central apnoea was defined as cessation of breathing with no respiratory effort for more than 10 seconds. Apnoeic episodes with features of both obstructive and central events were categorised as mixed apnoeas. Hypopnoea was defined as a reduction in oronasal flow by more than 50% associated with arousals and/or desaturations. Apnoea–hypopnoea index (AHI) was defined as the total number of apnoeic and hypopnoeic episodes per hour. The number of episodes of oxygen desaturation by more than 4% from baseline per hour was also noted (oxygen desaturation index).
Lateral neck radiograph
The lateral neck radiograph was performed using standard techniques with the patient's neck extended. The distance between the source of radiation and the film was 150 cm with a screen cassette at 10–12 mas and 82–84 kvp. The TP ratio (fig 1) was measured according to the method of Shintani and colleagues15 by a single investigator (JK) who was blinded to the patients' clinical or polysomnographic findings.

Graphic description of measurements of a lateral cephalography. A, adenoid; N, nasopharyngeal measurement; P, pharyngeal measurement; S, sella turcica; T, tonsil. A and T are measured as a perpendicular distance at their maximum convexity. T/P is the ratio of the width of the tonsil to the depth of the pharyngeal space.
Statistical analysis
The AHI, ODI, and TP ratio formed skewed distributions and were presented as median with interquartile range. Spearman's rank correlation was used to assess the association between the ratio and the various OSA parameters. Comparisons of the ratios of mild versus moderately severe OSA subjects were made using Mann–Whitney test.
A receiver operating characteristic curve (ROC)16 analysis was used to assess the optimal cut off probability value for predicting cases with moderate/severe OSA using the TP ratio. An ROC curve is constructed by plotting the sensitivity versus 1-specificity of the TP ratio for moderate/severe OSA, identified from multiple logistic regression. The area under the ROC curve estimated the probability of correctly predicting moderate/severe OSA, with an area of 1.0 as perfect prediction and an area of 0.50 being no better prediction than chance. An optimal prediction function should yield a high true positive rate (sensitivity) as well as a low false positive rate (high specificity). The choice of the critical cut off point, however, would vary with the perceived trade offs between sensitivity and specificity.
Analyses were performed using SPSS for Windows (release 10.1, SPSS Inc., Chicago, Illinois, USA). The level of significance was set at 5% in all comparisons, and all statistical testing was two sided.
RESULTS
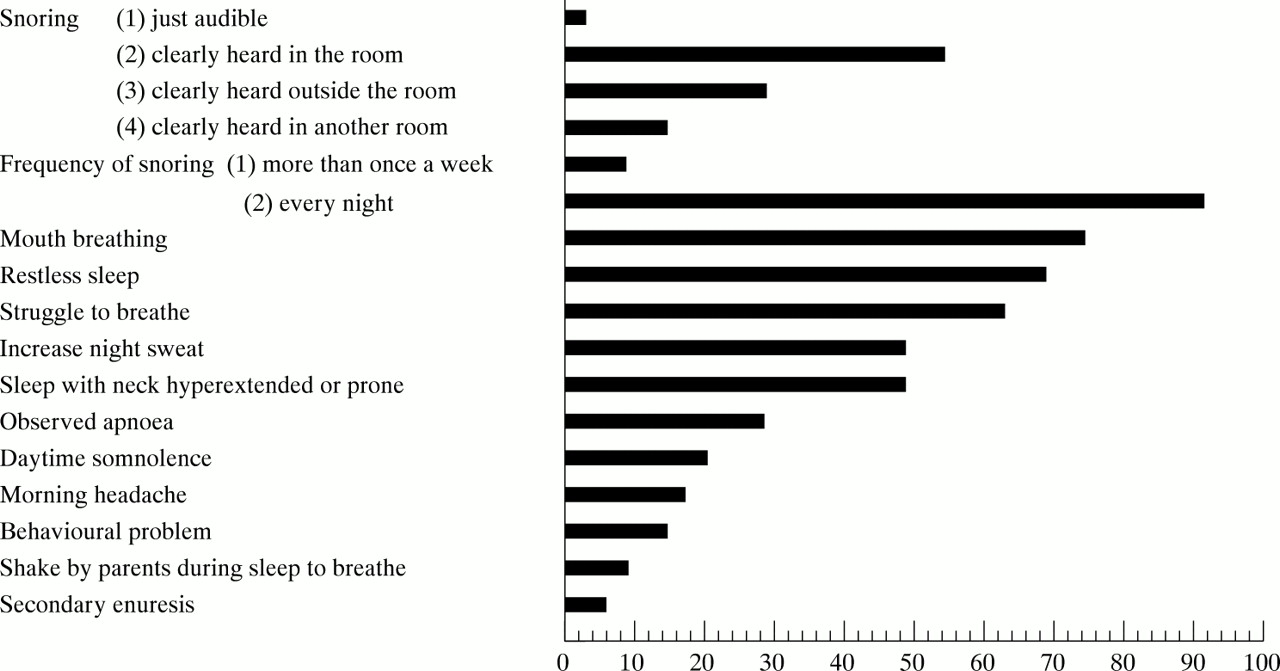
A total of 24 boys and 11 girls with a median age of 6.2 years (interquartile range 4.0 to 10.30) were included in the study. None were considered to be obese (<120th centile of ideal weight for height) or had evidence of growth failure. Table 1 and fig 2 show demographic data and presenting symptoms respectively. All but three subjects had snoring every night and the snoring could at least be heard in the same room in 34 of the 35 subjects. Other common presenting night-time symptoms included restless sleep (69%), struggle to breathe during sleep (63%), increased night sweat (49%), and sleeping with the neck extended or in the prone position (49%). Ten children were found to have apnoeic episodes during sleep, but only three required stimulation to make them breathe again. Two children had secondary enuresis. The commonest daytime symptom was mouth breathing (74%). Daytime somnolence was a feature in seven children.
Demographic and OSA parameters for the 35 subjects

Frequency of presenting clinical features of OSA in the subjects (n = 35).
All children had tonsillar hypertrophy on clinical inspection, with 30 of the 35 subjects having a tonsil size of grade 2 or above. None of the subjects had features of pulmonary hypertension or cor pulmonale on physical examination, chest radiograph, or electrocardiogram.
As shown in table 1, the median AHI was 16.93 (interquartile range 8.41 to 28.29). The median ODI was 8.63 (interquartile range 2.16 to 16.03). The median TP ratio was 0.76 (interquartile range 0.65 to 0.8). All children slept well during the polysomnographic study, with an average sleep efficiency of 87%. Central and mixed apnoeas were rare.
A significant correlation was found between the TP ratio and the AHI and ODI (r = 0.798, p < 0.0001 and r = 0.505, p = 0.002 respectively). However, no correlation was found between the tonsil size assessed clinically with either the TP ratio or the various OSA parameters (table 2).
Spearman's rank correlations between the OSA parameters
In a previous unpublished study, we were able to identify patients with mild OSA by using an AHI <10. This group of patients had minimal obstructive episodes and no desaturations documented on sleep nasendoscopy compared to those with an AHI >10. In the current study, 24 cases had an AHI >10 (moderate/severe OSA) and 11 had an AHI <10 (mild OSA). There was a significant difference between the TP ratios of the two groups (0.80 versus 0.60, p < 0.0001). ROC curve analysis revealed that the optimal probability cut off for predicting moderate/severe OSA using TP ratio was 0.479, with the area under the curve being 0.973. The corresponding sensitivity and specificity were 95.8% and 81.8% respectively, while the positive and negative predictive values were 92.0% and 90.0% respectively.
DISCUSSION
OSAS is caused by a collapse of the upper airway during sleep when muscle tone of the upper respiratory tract decreases. It is therefore prone to occur in patients with narrowing of the upper airway. In the paediatric population, the commonest cause for this is adenotonsillar hypertrophy.
In our study looking at children with OSAS secondary to tonsillar enlargement, we used the TP ratio measured on standard lateral neck radiograph as an indicator of the degree of tonsillar enlargement. We believe that this measurement is more reliable than visual assessment of tonsillar size in judging the pharyngeal patency. We found that there was a significant correlation between the TP ratio and the severity of OSAS. This result is the first to our knowledge, to suggest a significant positive relation between tonsillar enlargement and OSAS. Previous studies have failed to establish a correlation between tonsil size assessed by direct inspection and the various parameters of OSAS.8–10 This well reported finding was also confirmed by our study, where a correlation between clinical tonsil size and severity of OSAS was not established. This is, however, not unexpected as on direct inspection, only the superior portion of the tonsil is seen, which does not reflect its true size and shape. This is further supported by our finding that there was no relation between tonsil size assessed clinically and the TP ratio.
The radiographic TP ratio used is a clinically useful index of pharyngeal patency as it compares the amount of tonsillar tissue with the size of the pharyngeal compartment. It is easy to measure as it does not require the use of any sophisticated equipment. Shintani and colleagues15 measured the TP ratio in 140 Japanese children with OSAS and an age matched control group of 54 children. Their mean age was 4.5 years. They found that the TP ratio increased with age and reached a peak when the children were 5–6 years, in both the control and OSAS groups. The value was also significantly greater in OSAS children than in controls in all age groups.
Paediatric OSAS has been suggested to be primarily an anatomical problem, but more evidence is accumulating to show that the underlying mechanism is in fact a complicated interplay between various factors. Our group, in a previous unpublished study, assessed the severity of OSAS with sleep nasendoscopy. We found that patients with an AHI <10 had mild disease as they had fewer obstructive episodes and no desaturations shown compared to those with moderate/severe disease and AHI >10. Brouillette and his group17 also used an AHI of 10 to denote patients with mild disease, and found that they could be managed with nasal steroid therapy with significant improvement in their symptoms. In the current study, we found 24 patients had an AHI >10, and 11 had an AHI <10. An ROC curve analysis found that a TP ratio of 0.479 was the optimal cut off for predicting moderate/severe cases of OSAS. The corresponding sensitivity and specificity were 95.8% and 81.8% respectively.
The gold standard diagnostic test for OSAS is still the overnight multichannel polysomnography, which enables detection of obstructive apnoeas, hypopnoeas, and arousals. However, the system is very expensive to set up and run; consequently it is not widely available in all public hospitals. Patients with suspected OSAS have thus to wait for a long time, usually months, before being assessed. Various studies have looked at other screening methods, for example, symptom score and pulse oximetry. It was found that these methods have good sensitivity but were unreliable in differentiating between the different degrees of severity of the condition.11 Our proposed method of using the TP ratio may prove to be a useful and simple clinical method in differentiating patients with OSA into mild disease and those with more significant problem. We are not advocating the use of this method in place of an overnight polysomnography. We are of the opinion that the TP ratio may screen out those patients with more severe OSAS so that they can be assessed at an earlier appointment. Before this method can be safely concluded to be widely applicable, it shoud be validated in a further cohort with a larger sample size.