Article Text

Abstract
Background: Several population-based studies have reported blood glucose levels and blood pressure to be risk factors for the development of diabetic retinopathy. These studies were initiated more than two decades ago and may therefore reflect the treatment and population composition of a previous era, suggesting new studies of the present population with diabetes.
Aim and methods: This cross-section study included 656 people with type 1 diabetes and 328 with type 2 diabetes. Crude prevalence rates of proliferative diabetic retinopathy, clinically significant macular oedema and several specific retinal lesions were assessed, together with their association to a simplified and internationally approved retinal grading.
Results: The point prevalence of proliferative retinopathy was found to be 0.8% and 0.3% for type 1 and type 2 diabetes. Equivalent prevalence rates of clinically significant macular oedema were 7.9% and 12.8%, respectively. The most frequently occurring retinal manifestations increased in number until retinopathy level 3, and then decreased.
Conclusion: The point prevalence of proliferative retinopathy is lower than that found in previous studies, whereas it is increased for clinically significant macular oedema. These data suggest different risk factors for these clinical entities.
- ETDRS, Early Treatment Diabetic Retinopathy Study
- HbA1c, glycated haemoglobin
- IQR, interquartile range
- WESDR, Wisconsin Epidemiologic Study of Diabetic Retinopathy
Statistics from Altmetric.com
- ETDRS, Early Treatment Diabetic Retinopathy Study
- HbA1c, glycated haemoglobin
- IQR, interquartile range
- WESDR, Wisconsin Epidemiologic Study of Diabetic Retinopathy
Diabetic retinopathy and diabetic maculopathy are the leading causes of visual acuity reduction and blindness among people with diabetes.1,2 A pooled analysis of eight population-based studies on US adults aged >40 years has shown a crude prevalence of diabetic retinopathy at 40.3% and that of vision-threatening retinopathy at 8.2%.3 Owing to the increased risk of visual impairment among people with diabetes, several studies have explored these conditions, thus far resulting in >500 papers published on the subject.4 The literature is dominated by a small number of large-scale studies, such as the Wisconsin Epidemiologic Study of Diabetic Retinopathy (WESDR), UK Prospective Diabetes Study Group, Diabetes Control and Complication Trial and Early Treatment Diabetic Retinopathy Study (ETDRS) trials,5,6,7,8,9,10 which are considered to define the gold standard for treatment and for understanding risk factors for diabetic retinopathy and diabetic maculopathy. Despite their importance, these studies were initiated decades ago and may therefore reflect the treatment and population composition of a previous era.4
Previous population-based studies have reported blood glucose levels and blood pressure as risk factors for the development of diabetic retinopathy and diabetic maculopathy.11–13 Owing to the timely changes in risk factors, new studies on larger groups of patients with diabetes are required with the purpose of assessing anew the prevalence of primary diabetic retinopathy parameters and the effect of suspected risk factors. The present study was therefore initiated and included a large group of people with diabetes from the North Jutland County Diabetic Retinopathy Study.
METHODS
Study population
In the period from 1 April 2000 to 30 April 2004, 656 people with type 1 diabetes (339 women and 317 men) and 328 with type 2 diabetes (148 women and 180 men) underwent at least one retinopathy screening. The 656 people with type 1 diabetes were nearly entirely included from Aalborg (an urban area in the County of North Jutland, Denmark), representing 70–75% of people with adult type 1 diabetes in the region. The 328 people with type 2 diabetes were enrolled from the entire County of North Jutland, mainly as a result of malregulation of diabetes. These people included <5% of people registered as having type 2 diabetes in the County.
Definition of diabetes type
-
Type 1 diabetes: Patients with diabetes, aged <30 years at diagnosis, usually normal or underweight at diagnosis, or with a history of ketoacidosis.
-
Type 2 diabetes: Patients with diabetes, aged >30 years at diagnosis, normally overweight at diagnosis, without a history of ketoacidosis.
Retinopathy screening
-
All patients underwent a visual acuity test under standardised low-light conditions. A Moller-Wedel 245 projector (Wedel, Germany) was used, with decimal progression scale.
-
The retina was photographically recorded after medical dilatation of the pupil (Tropicamid 1% and phenylephrine 10%). It included two 50° retinal photos from each eye; a digital camera (Zeiss DCS 420, Jena, Germany; resolution 1524×1012 pixels) was used. One photo was centred at the macular region, the other included the optic disc and the nasal part of the retina.
-
The digitised retinal recordings and the non-ophthalmic parameters were electronically transferred (without data compression) to the Department of Ophthalmology, Aarhus University Hospital, Aalborg, Denmark, for detailed retinal grading and subsequent data collection.14
-
Retinal lesions were quantified using the colour fundus photographic recordings presented on a high-resolution screen (Nokia 446 PRO). However, microaneurysms and haemorrhages were quantified after black–white conversion for optimal visualisation using advanced computational data centre grid (http://www.acdsee.com). From the quantitative gradings of specific retinal lesions, all eyes were subsequently categorised using a simplified and internationally approved retinopathy scale.15 The quantification of retinal lesions using the present digital photographic equipment and a colour film (Kodak Ektacrom 64; ERP 135–36) was found identical to and also comparable with the ETDRS photographic procedure.16
-
When the retinal grading was uncertain, or when proliferative retinopathy or clinically significant macular oedema was suspected, those people were called in for an additional clinical examination (22% of all examinations), including a stereoscopic evaluation of the macular region. If people failed to appear they were called again, resulting in 100% participation.
Non-ophthalmic parameters
The following non-ophthalmic parameters were recorded and their methods of measurement are described below.
-
Regulation and blood pressure: Glycated haemoglobin (HbA1c; %), diastolic blood pressure (mm Hg) and systolic blood pressure (mm Hg)
-
Person characteristics: Age (years), height (m), weight (kg), body mass index (weight in kg/height squared in m2)
-
Characteristics of diabetes: Duration of diabetes (years), age at onset (years), presence of neuropathy and nephropathy
-
Treatment: Whether taking insulin, oral antidiabetics, blood pressure-reducing drugs or lipid-lowering drugs, or following only diet.
HbA1c was measured using Bio-Rad variant II (Bio-Rad laboratoriums; normal reference interval 0.045–0.06%). Neuropathy was defined from the clinical symptoms and also from biotesometry (normal reference <25 V).
Detailed retinal grading
All photographic recordings were assessed by one of three ophthalmic specialists experienced in quantifying retinal lesions. The graders were trained in the classification strategy before the study started. All specific retinal lesions were quantified as indicated below (range of quantification and scales are in parentheses). Microaneurysms and hard exudates (0–50 in number); haemorrhages and soft exudates (0–20 in number); white blood vessels, fibrous tissue, venous beading, venous loops, double-contoured venous vessels, intraretinal microvascular abnormality and new vessels elsewhere (0–4 quadrants); new vessels on the disc, preretinal bleeding, vitreous bleeding and previous peripheral laser photocoagulation (presence or absence).
Simplified retinopathy scale
On the basis of the above-mentioned detailed quantifications, the retinal status was transformed into a simplified retinopathy scale using an internationally approved grading15 as described below.
-
Level 0: no abnormalities
-
Level 1: microaneurysms only
-
Level 2: more than just microaneurysms but less severe than level 3—that is, microaneurysms and <20 haemorrhages in at least one quadrant or venous beading in one quadrant
-
Level 3: any of the following: 20 or more intraretinal haemorrhages in each of the four quadrants; definite venous beading in ⩾2 quadrants; prominent IRMA in ⩾1 quadrant; no signs of proliferative retinopathy
-
Level 4: one or more of the following: neovascularisation; vitreous or preretinal haemorrhages; previous panretinal laser treatment; further divided into two levels (4a and 4b) for separation of new and previous proliferative development
-
Level 4a: newly diagnosed neovascularisation without signs or history of laser treatment
-
Level 4b: previous laser treatment; eyes with visible peripheral laser scars
-
Clinically significant macular oedema: registered after a clinical examination and using the ETDRS criteria.17
Racial and social factors
The study comprised Caucasians and only few people of other ethnic races. The social status was not known, but in Denmark the reduction in pay differentials is very high.
Data analyses
The statistical analyses included only the right eyes to avoid bias.
Data were composed from several sources. Typing errors and mismatch of cases were controlled for by visual inspection of scatter plots and validating selected cases. Data were statistically analysed using SPSS V.12.0.2 for Windows and R 2.1.1.18 Non-parametric methods were used for comparisons.
For continuous data, differences in location of parameters between clinical types of diabetes were assessed by the Mann–Whitney U test and those between retinopathy grading by Kruskal–Wallis one-way analysis of variance by ranks. For categorical data, Pearson’s χ2 statistic was used. Trends across increasing severity of retinopathy gradings, excluding level 4b for which previous treatment may have affected the parameters, were assessed using the Jonckheere–Terpstra test for continuous data and the Mantel–Haenszel linear-by-linear association for categorical data.
Logistic transformation was used for the confidence interval (CI) calculations of crude prevalences. Owing to skewness in the distribution of parameters, location and scale estimated in connection with group comparisons are presented as median (interquartile range (IQR)).
RESULTS
The study population included 656 people with type 1 diabetes and 328 people with type 2 diabetes, with a median age of 37.3 (IQR 19.0−48.5) and 58.1 (IQR 15.0−65.0) years, respectively. In all, 51.7% and 45.1% of participants were women for type 1 and type 2 diabetes, respectively. The subsequent specification of crude prevalences are given as 95% CIs; other numerical parameters are specified by median and IQR.
The point prevalence of clinically significant macular oedema was 7.9% (IQR 6.1–10.3%) for type 1 diabetes and 12.8 (IQR 9.6–16.9%) for type 2 diabetes. The point prevalence of clinically significant macular oedema increased until retinopathy level 3, and subsequently decreased for both types of diabetes (fig 1). At retinopathy level 3, the prevalence of clinically significant macular oedema was 31.6% (IQR 14.9–54.8%; 6/19) and 66.7% (37.6–86.9%; 8/12) for type 1 and type 2 diabetes, respectively. Similar results were observed for the left eye.

Prevalences of macular oedema indicated at each retinopathy level and for patients with type 1 and type 2 diabetes.
The crude prevalence of proliferative retinopathy was 5.6% (95% CI 4.1% to 7.7%; 37/656) for type 1 diabetes and 0.9% (95% CI 0.3% to 2.8%; 3/328) for type 2 diabetes. The corresponding point prevalences of newly diagnosed proliferative retinopathy were 0.8% (5/656) and 0.3% (1/328). Similar results were observed in the left eyes.
The most commonly occurring ocular manifestations were microaneurysms, haemorrhages, hard exudates and soft exudates. For patients with type 1 and 2 diabetes, these manifestations increased in number until retinopathy level 3, and then decreased (fig 2). The most commonly occurring manifestation was microaneurysms, followed by haemorrhages, hard exudates and soft exudates (fig 2).

The numbers of microaneurysms, haemorrhages, soft exudates and hard exudates given at each retinopathy level and for patients with type 1 and type 2 diabetes.
In the total sample of 984 people, rarely occurring ocular manifestations were white blood vessels (n = 9, 0.9%), fibrous tissue (n = 12, 1.2%), venous bleeding (n = 25, 2.5%), venous loops (n = 8, 0.8%), double-contoured venous vessels (n = 7, 0.7%), IRMA (n = 23, 2.3%), preretinal bleeding (n = 1, 0.1%) and vitreous bleeding (n = 0). These manifestations were present only at retinopathy level 3 or higher.
The mean (standard deviation (SD)) visual acuity at retinopathy level 0 was 1.0 (SD 0.2) and 0.9 (SD 0.2) for people with type 1 and 2 diabetes, respectively. The visual acuity gradually decreased to retinopathy level 4b: 0.8 (SD 0.4) and 0.65 (SD 0), in the corresponding groups (table 1).
Visual acuity at the various levels of retinopathy
Median HbA1c was 8.3% (IQR 1.6%) in people with type 1 diabetes and 8.1% (IQR 2.3%) for those with type 2 diabetes. The median systolic and diastolic blood pressure values were 130.0 (IQR 20.0) and 80.0 (IQR 15.0) mm Hg for those with type 1 diabetes and 140.0 (IQR 25.0) and 80.0 (IQR 15.0) mm Hg for those with type 2 diabetes. The median body mass index was 24.1 (IQR 4.5) kg/m2 for people with type 1 diabetes and 29.7 (IQR 8.3) kg/m2 of those with type 2 diabetes (table 2).
Median values for non-ophthalmic parameters at the various retinopathy levels
The use of insulin, antidiabetics, blood pressure-reducing drugs and plasma lipid-lowering drugs was recorded (table 3).
Fraction of people with diabetes using selected groups of medicines
The quality of the photographic recordings was expressed as the number of useless photographic recordings (7/984, 0.7%) and was caused by bad fixation (n = 4), small pupil (n = 1), blurred optical media (n = 4) and constantly moving eyes (n = 3).
The correlation between the simplified retinal grading system for the right and that for the left eye was 0.75 for type 1 diabetes and 0.76 for type 2 diabetes, expressed as Spearman’s r.
DISCUSSION
The present study suggests a reduced prevalence of proliferative retinopathy compared with that in earlier studies, which could be the result of a general reduction in blood glucose. This study also suggests an increased prevalence of clinically significant macular oedema, possibly indicating that other unknown factors may affect the presence of this ocular manifestation. The most commonly occurring retinal lesions showed a non-linear progression with the retinopathy level.
The present study included a large group of people with diabetes from the North Jutland County Diabetic Retinopathy Studies diagnosed with type 1 (n = 656) or type 2 (n = 328) diabetes. The study population with type 1 diabetes was nearly entirely enrolled from larger Aalborg and comprised 70–75% of all patients with type 1 diabetes in that region. The study population with type 2 diabetes was primarily referred from all parts of the County of North Jutland, Denmark, primarily as a result of malregulation, and comprised <5% of all people with type 2 diabetes. The study groups were therefore not fully representative for the entire referral population; prevalence rates must therefore be interpreted with caution.
Diabetic retinopathy
Type 1 diabetes
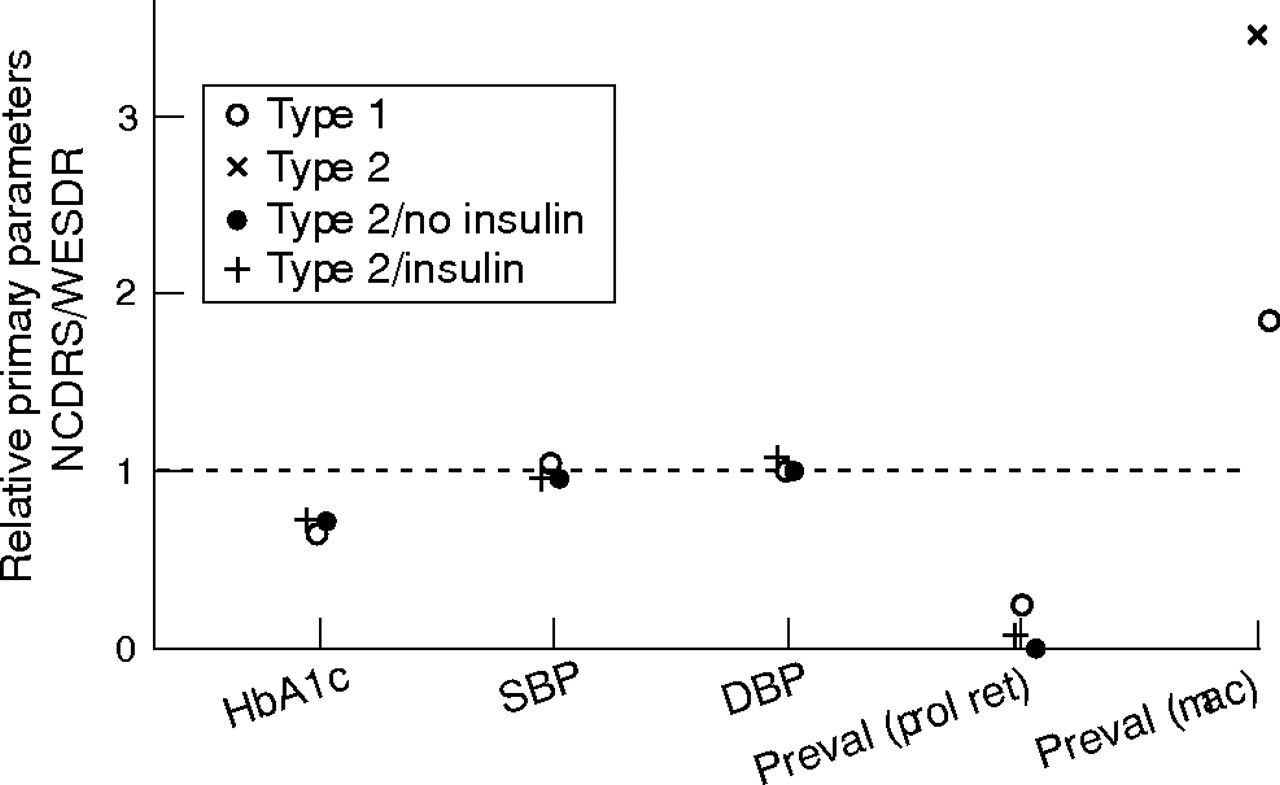
The WESDR reported mean systolic and diastolic blood pressures of 123 (SD 19) and 79 (SD 11) mm Hg, respectively19; other population-based studies20 including the present examination reported similar results (fig 3).

Results from the Wisconsin Epidemiologic Study of Diabetic Retinopathy (WESDR) and the North Jutland County Diabetic Retinopathy Study (NCDRS) are compared with respect to glycated haemoglobin (HbA1c) and blood pressure (systolic and diastolic, SBP and DBP, respectively) on prevalence (Preval) of proliferative retinopathy (prol ret) and clinically significant macular oedema (mac). The ratio between medians is depicted, WESDR being reference—that is, a value >1 indicates a higher median in the NCDRS.
The WESDR reported a mean HbA1c value of 12.5% (SD 2.6%)19; it was 8.3% (SD 1.6%) in this study, suggesting an improved regulation of blood glucose compared with that seen in previous studies (fig 3).
Previous studies reported the prevalence of proliferative retinopathy to be associated with blood glucose and blood pressure.11–13 This lower prevalence today19,21 could therefore be attributed to an improved regulation of blood glucose levels (fig 3) as reported in other studies.7,8,19
Type II diabetes
The mean systolic blood pressure was 146 (SD 24) and 146 (SD 22) mm Hg among insulin-treated and non-insulin-treated participants in the WESDR.20 The equivalent diastolic blood pressures were 79 (SD 12) and 80 (SD 11) mm Hg, respectively20; the present study showed equivalent results (fig 3). In the WESDR, mean HbA1c values were 11.6% (SD 2.2%) and 10.2% (SD 2.3%) for late-onset insulin-treated and non-insulin-treated participants, respectively.20 In the present study, HbA1c was 8.4% and 7.1% in insulin-treated and non-insulin-treated people with diabetes, suggesting a better regulation of blood glucose compared with that reported in previous studies (fig 3).
The WESDR reported crude prevalences of proliferative retinopathy at 12.0% and 2.2% for insulin-treated and non-insulin-treated people with diabetes.22 In our study, the point prevalences of proliferative retinopathy were 0.5% and 0% in insulin-treated and non-insulin-treated people with type 2 diabetes. The lower prevalence compared with that in previous studies could again be a result of an overall decreased blood glucose in the recent years (fig 3).
Clinically significant macular oedema
Type 1 and type 2 diabetes
The observed differences in prevalence rates with respect to clinically significant macular oedema and proliferative retinopathy compared with that reported in earlier studies (fig 3) suggest different pathogenesis for these manifestations. It points towards other and so far unknown risk factors for the development of clinically significant macular oedema among people with type 1 or type 2 diabetes.
Frequently occurring retinal lesions
The most frequently occurring retinal manifestations were increased in number until retinopathy level 3 (severe retinopathy), after which they decreased (fig 2). The number of retinal lesions decreased before retinal laser photocoagulation was carried out, and hence lesions were not caused by this treatment. These findings might have some implications. Firstly, the non-linear changes in the most frequently occurring retinal lesions necessitate more than one retinal status to characterise adequately every person with diabetes (ie, raising or lowering part of the curve). Secondly, timely reductions in the number of retinal lesions might give a false impression of a decreased risk for visual impairment and lead to erroneous decisions of prolonged interval between the retinal statuses. Thirdly, the relatively small number of retinal lesions in patients with severe retinopathy suggests that these lesions can be regarded as only indirect estimates of the so far unknown fundamental pathogenic mechanisms in diabetic retinopathy.
Rarely occurring ocular lesions
All these manifestations were seldom seen (0–2.5%) and exclusively in patients with more severe retinopathy (level 3 and higher). Therefore, they represent late-occurring lesions and thus are not important for understanding the early changes in proliferative retinopathy and maculopathy.
REFERENCES
Footnotes
-
Published Online First 6 July 2006
-
Competing interests: None declared.