Article Text

Abstract
Objective Colorectal cancer (CRC) is the second leading cause of cancer-associated mortality in the USA. The faecal microbiome may provide non-invasive biomarkers of CRC and indicate transition in the adenoma–carcinoma sequence. Re-analysing raw sequence and metadata from several studies uniformly, we sought to identify a composite and generalisable microbial marker for CRC.
Design Raw 16S rRNA gene sequence data sets from nine studies were processed with two pipelines, (1) QIIME closed reference (QIIME-CR) or (2) a strain-specific method herein termed SS-UP (Strain Select, UPARSE bioinformatics pipeline). A total of 509 samples (79 colorectal adenoma, 195 CRC and 235 controls) were analysed. Differential abundance, meta-analysis random effects regression and machine learning analyses were carried out to determine the consistency and diagnostic capabilities of potential microbial biomarkers.
Results Definitive taxa, including Parvimonas micra ATCC 33270, Streptococcus anginosus and yet-to-be-cultured members of Proteobacteria, were frequently and significantly increased in stools from patients with CRC compared with controls across studies and had high discriminatory capacity in diagnostic classification. Microbiome-based CRC versus control classification produced an area under receiver operator characteristic (AUROC) curve of 76.6% in QIIME-CR and 80.3% in SS-UP. Combining clinical and microbiome markers gave a diagnostic AUROC of 83.3% for QIIME-CR and 91.3% for SS-UP.
Conclusions Despite technological differences across studies and methods, key microbial markers emerged as important in classifying CRC cases and such could be used in a universal diagnostic for the disease. The choice of bioinformatics pipeline influenced accuracy of classification. Strain-resolved microbial markers might prove crucial in providing a microbial diagnostic for CRC.
- COLORECTAL CANCER
- COLORECTAL ADENOMAS
- META-ANALYSIS
- INTESTINAL BACTERIA
Statistics from Altmetric.com
Significance of this study
What is already known on this subject?
Colorectal cancer (CRC) remains the second leading cause of cancer-associated mortality, despite the fact that those diagnosed at an early stage have >90% chance of survival.
Standard recommendations of screening colonoscopy are invasive and expensive. Adherence to existing non-invasive testing is low, and these tests are not sensitive to early-stage CRC or adenoma.
A wide range of cross-sectional studies have reported an association between the faecal microbiome and CRC; however, there is limited agreement in the taxa reported.
What are the new findings?
In a first of its kind microbiome-based meta-analysis for CRC, we identified microbial features, which in conjunction with clinical traits, provide classification accuracies exceeding 80%.
In addition to confirming previously reported taxa, we identified novel associations of bacteria, including Parvimonas micra ATCC 32270 and Parabacteroides distasonis, with CRC across multiple cohorts and robust to technological and demographic variation.
How might it impact on clinical practice in the foreseeable future?
A combination of faecal microbial markers has the potential to serve as a non-invasive, sensitive and specific clinical diagnostic test. Microbial markers may offer a promising supplement to faecal occult blood and faecal immunochemical tests.
Introduction
Colorectal cancer (CRC) is the third most incident cancer globally and second leading cause of cancer-associated mortality in the USA in men and women combined.1 Survival exceeds 90% if the cancer is detected at an early, localised stage, but this decreases to 13% with advanced metastatic disease.2–4 Despite this, adherence to screening recommendations is limited. More than 30% of individuals from high-risk groups (ie, age ≥50 years) report never having been screened for CRC.5 Colonoscopy, which is invasive, expensive and fails to address interval cancers (ie, CRC diagnosed within 6–36 months following a screening colonoscopy), represents the most commonly used screening method.5 ,6 Home-based faecal occult blood tests (FOBTs) are used less frequently, owing to perceptions that they are not effective in reducing cancer-associated mortality.5 FOBT also has low sensitivity in detecting precancerous lesions or colorectal adenoma (CRA).7 Cologuard is a newer multitarget stool DNA test. Although it has high sensitivity for detecting CRC, its sensitivity for detecting non-advanced CRA is low, it is more expensive than FOBT and coverage by insurers varies.8 ,9 The shortcomings of current screening methods highlight the need for a sensitive, non-invasive diagnostic test for CRC and precancerous lesions, as such a test might increase patient screening rates.
Most CRC and CRA cases are sporadic in nature (ie, no genetic pattern of inheritance), hence environmental factors such as the gut microbiome have been extensively studied to identify ‘signals’ reflecting the disease.10–17 A unifying microbial signature associated with CRC and precancerous CRA has not been defined. Although some concordance exists with respect to reported CRC-associated taxa (eg, Fusobacterium nucleatum, Peptostreptococcus sp, and Porphyromonas sp), a consistent signal for CRC has not been established.10 ,11 ,18 ,19 Reported studies have relied on the assessment of a single prokaryotic taxonomic biomarker, the 16S ribosomal RNA (rRNA) gene, which, in theory, would allow the studies to be directly comparable with one another. However, varying experimental methods, 16S rRNA gene target region, sequencing platform, informatics techniques and demography have limited direct comparability. By accessing the raw 16S rRNA gene sequence data from multiple faecal microbial studies and analysing it in a consistent manner across all studies, we aimed to determine whether generalisable microbial markers for CRC and CRA could be identified.
We evaluated the performance of two bioinformatics pipelines, a closed-reference operational taxonomic unit (OTU) assignment approach used in previously published meta-analyses20–22 and a novel approach that used more raw sequence data and offered strain-level resolution in some cases. Finally, where data were available, we compared our composite microbial markers to the take-home guaiac-based FOBT, a non-invasive but imprecise test.23 ,24
In this first of its kind meta-analysis of faecal CRC-microbiome association studies, we sought to determine whether a common set of 16S rRNA gene-based microbial markers from several different studies could be identified such that, either alone or together with the FOBT test, they improved diagnostic accuracy.
Methods
Study search, selection and inclusion
Attempting to present an unbiased synthesis of epidemiological studies evaluating associations of the faecal microbiome with CRC, we followed the Meta-Analysis of Observational Studies in Epidemiology checklist of recommendations to identify and include studies for our analysis.25 We performed a systematic PubMed search to identify studies with the terms colorectal cancer, colon cancer and colorectal adenocarcinoma in the title, which included human subjects and were published within the last 10 years. The final detailed search term is provided in online supplementary methods. Studies fit our inclusion criteria if they (1) used 454 or Illumina sequencing for 16S rRNA gene amplicons, (2) included histologically confirmed CRC or CRA samples and controls and (3) had sequence and associated metadata available publicly or shared by authors by 1 April 2016.
supplementary methods
Thirteen studies evaluating faecal microbial associations with CRC were identified by the systematic search described above. Nine of these had sequence data in public repositories (eg, the Sequence Read Archive, European Nucleotide Archive and MG-RAST) or provided raw data on request. Eight of these had CRC or CRA and controls in their study design.10–14 ,26–28 One study evaluated faecal samples exclusively from CRA cases and controls.29 Raw sequence data for the remaining four studies were not publicly available, were not provided on request or were available through controlled access only.15 ,30–32
Patient metadata
Those participants for whom disease status (ie, CRC, CRA or control) was available were included in the analysis. Zeller et al10 excluded large adenomas from their analysis and combined small adenomas as controls. We evaluated all of these samples as CRA specimens. The clinical variables of age, gender, body mass index (BMI) (or height and weight) and the outcome of FOBT were also available for three studies.10–12
Bioinformatics analysis
Each study was analysed using two bioinformatics pipelines, an open-source closed-reference OTU assignment pipeline implemented in quantitative insights in microbial ecology (QIIME) closed reference (QIIME-CR )33 and a pipeline that aligns faecal 16S sequences against references in the StrainSelect database (secondgenome.com/StrainSelect) and conducts de novo clustering using the Strain Select UPARSE (SS-UP) algorithm.34
The rationale behind using two pipelines was to assess an alternate approach to closed-reference OTU picking, which is commonly used in microbiome meta-analyses, and to determine how different OTU-clustering algorithms might affect downstream performance of the composite biomarker for CRC. SS-UP had the added advantage of strain-level annotations for some OTUs, whereas QIIME-CR offered species-level resolution for some. We sought to determine if microbiome-based differences between diseased and control subjects were substantial enough to discriminate among subjects using either bioinformatics pipeline, or if the differences were subtle, such that a specialised algorithm might be required. For each pipeline, quality-filtering criteria and sequence use are provided in online supplementary table S1 and details regarding implementation of each pipeline are provided in the online supplementary methods.
supplementary tables
Statistical analysis
Resulting OTU tables from each pipeline were analysed using univariate and multivariable techniques, and all statistical analysis was conducted in R-3.2.1. Samples from patients documented as receiving chemotherapy or radiotherapy, having <100 reads per sample and OTUs occurring in <5% of all samples were excluded from analysis for both pipelines. Data were rarefied for α diversity comparisons to a depth of 1000 without replacement but were not rarefied for any other analyses.35 Global community properties were evaluated using phyloseq,35 ,36 and permutational analysis of variance (PERMANOVA) was performed with the adonis function in vegan.37 Differential abundance analysis (between cases and controls) was performed using DESeq2 at the species (QIIME-CR) and strain (SS-UP) levels. To identify microbial features that occurred universally in CRC and CRA cases and were robust to technical variation, we applied a random effects model (REM) to obtain adjusted log2fold change summary estimates (considered significant at false discovery rate (FDR) p<0.1). This was performed using the metafor package in R and treating study as a random effect.38 Random forest (RF) models were used to determine whether a composite faecal microbial biomarker could discriminate CRC and CRA cases versus controls. Combined relative abundance-transformed OTU counts across all studies were analysed using the caret package in R.39 ,40 Additional details regarding the analysis are provided in the online supplementary methods.
Results
We compiled 16S rRNA gene sequencing data from nine faecal CRC microbiome studies published from 2012 to 2016. Study sizes varied from 12 to 129 subjects, and we analysed a total of 59 163 765 raw 16S rRNA gene sequences through two bioinformatics pipelines. This combined data set consisted of 195 CRC, 79 CRA and 235 controls. The studies varied with respect to DNA extraction method, 16S rRNA gene variable region targeted, sequencing platform and study characteristics and are summarised in tables 1 and 2. Sequence lengths and counts were non-uniform across studies, but SS-UP retained a greater number of reads than QIIME-CR.
Characteristics of faecal studies included in the meta-analysis
Sequence statistics of studies included in the meta-analysis
Bray-Curtis dissimilarity and the Jaccard index were used to evaluate the effects of abundance and carriage, respectively. Ordination analysis revealed substantial variation among samples with respect to microbial community composition. This is summarised in figure 1, where approximately 11%–23% of the variation along axis 1 is explained, depending on the metric and informatics pipeline used. Ordinations from SS-UP captured a greater amount of the total variation along the first two axes than did those from QIIME-CR. Separation along axis 1 occurred primarily by study, followed by variable region and sequencing platform. Given the large differences on those parameters, separation between cases and controls was not readily observed.
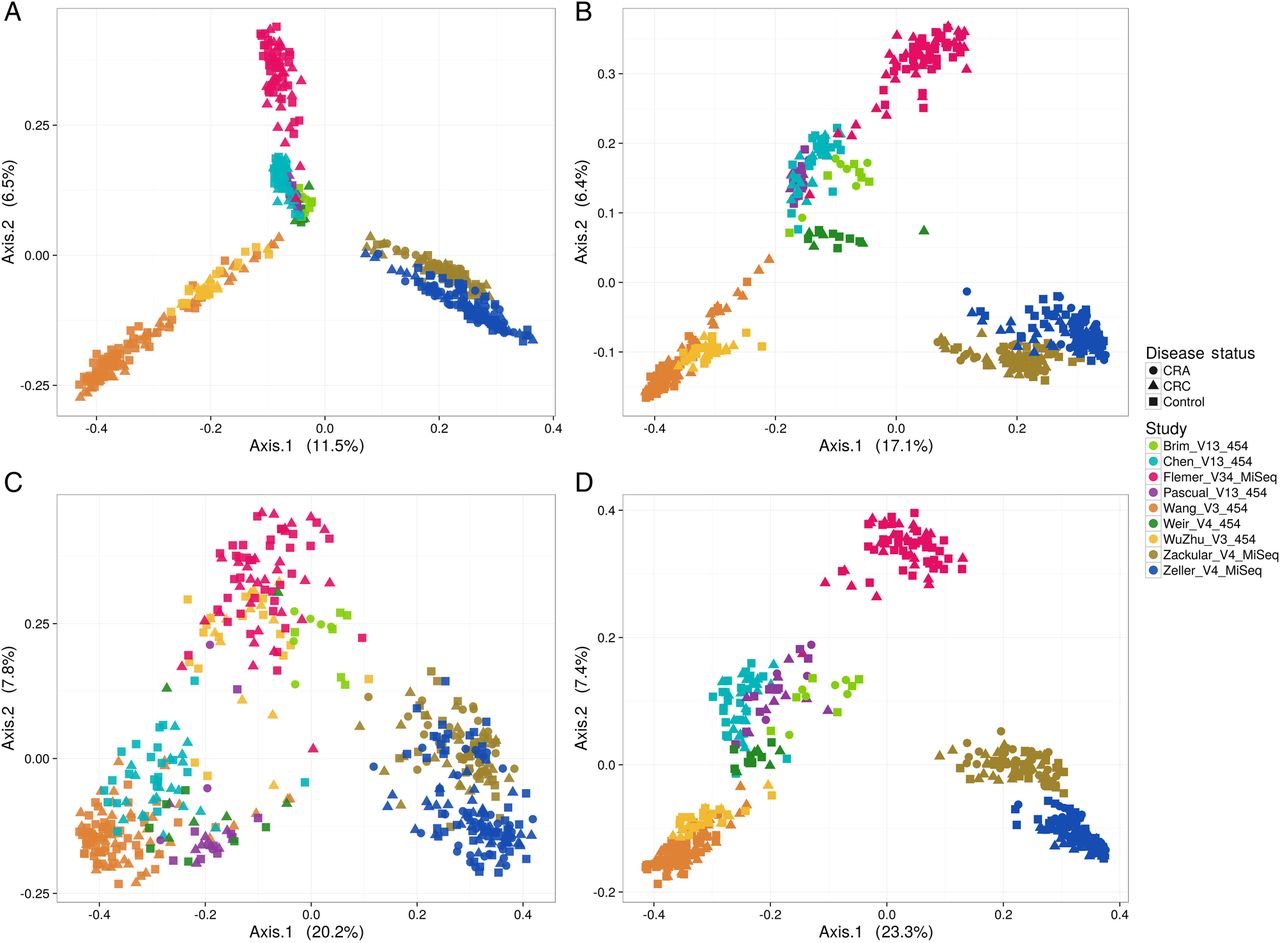
Principal coordinates analysis depicting the relationship between microbial composition from different study cohorts and their phenotypes. Plot points indicate individual samples, shapes indicate disease status (colorectal adenoma (CRA), colorectal cancer (CRC)) and colours indicate various studies included in the meta-analysis (target gene and sequencing platform are also incorporated in the study acronym). Communities are compared using Bray-Curtis (A and C) dissimilarity and the Jaccard index (B and D). (A) and (B) The ordination on QIIME closed reference operational taxonomic unit abundance tables. Cohorts cluster tightly illustrating a strong study effect followed by the gene target region sequenced. (C), (D) Show the ordination on Strain Select, UPARSE bioinformatics pipeline (SS-UP) abundance tables. Although the study effect is strong, there is more discrimination in cases and controls (% variation explained) by the ordinations on SS-UP abundances for both the Bray-Curtis dissimilarity and Jaccard index.
PERMANOVA indicated that microbiome composition differed significantly as a function of disease status; however, the lack of homogeneity of variance between cases and controls is likely to have influenced this result. After confirming homogeneity of variance, microbiome composition was significantly different by PERMANOVA across BMI categories, sequencing platforms FOBT test results and metastatic disease classification (denoted by M in tumor node metastasis (TNM) staging) (where information available) for either informatics pipeline or sometimes both (see online supplementary table S2).
Global community properties measured by α diversity indices were similar between CRC cases and controls in SS-UP and CRA cases and controls in both the SS-UP and QIIME-CR pipelines. The Shannon and inverse Simpson indices were significantly lesser in CRA cases relative to controls in the QIIME-CR pipeline by Monte-Carlo permutation-based t-tests (see online supplementary figure S1 and supplementary table S3). The Firmicutes/Bacteroidetes ratio did not differ in either CRC or CRA cases relative to controls.
Supplementary figures
Postfiltering, a total of 895 and 3511 OTUs were retained for the SS-UP and QIIME-CR pipelines, respectively, for the analysis of differential abundances between CRC cases and controls. Peptostreptococcus anerobius, Parvimonas, Porphyromonas, Akkermansia muciniphila and Fusobacterium sp were significantly enriched in CRC cases relative to controls across both pipelines (see online supplementary figure S2 and online supplementary table S4A) The SS-UP pipeline identified significant enrichment of specific strains in CRC cases, including Porphyromonas asaccharolytica ATCC 25260 and Parvimonas micra ATCC 33270. Significant enrichment of Pantoea agglomerans in CRC cases was also identified from QIIME-CR (see online supplementary table S5A).
In the CRA versus control comparison, 710 and 2586 OTUs were analysed from the SS-UP and QIIME-CR pipelines, respectively. OTUs within the genera, Prevotella, Methanosphaera and Succinovibrio, and species, Haemophilus parainfluenzae, were significantly enriched in both pipelines. SS-UP identified unique strains such as Synergistes family DSM 25858, Methanosphaera stadtmanae DSM 3091 as significantly differential abundant by DESeq2. A muciniphila was less abundant in CRA cases relative to controls by the QIIME-CR (see online supplementary figure S2 and online supplementary table S4B and S5B).
OTUs within the genera Ruminococcus and Lactobacillus and the family Enterobacteriaceae were consistently enriched in both CRC and CRA cases relative to controls. In particular, Fusobacterium sp was enriched in CRC cases but not among CRA cases.
We built an REM to evaluate the degree to which microbial markers of disease were consistent across studies. A total of 142 OTUs from the SS-UP pipeline and 388 OTUs from the QIIME-CR pipeline occurred in five or more studies. The strain P micra ATCC 33270 was significantly elevated in CRC cases, relative to controls, in five out of the eight studies by SS-UP (adjusted REM log2fold estimate: 3.3, 95% CI 2.2 to 4.5, REM p<0.001, FDR-adjusted p<0.001). Other examples from the SS-UP pipeline include OTUs within Proteobacteria (adjusted REM log2fold estimate across eight studies: 1.96, 95% CI 0.8 to 3.1, REM p=0.001, FDR p=0.07) and Streptococcus anginosus (adjusted REM log2fold estimate across five studies: 1.4, 95% CI 0.4 to 2.4, REM p=0.008, FDR p=0.19). Despite the biological and technical heterogeneity associated with these studies, the above markers emerged as significant signals for CRC (see figure 2A and online supplementary table S6A).

Forest plot of selected Strain Select, UPARSE bioinformatics pipeline (SS-UP) (A) and QIIME-CR operational taxonomic units (OTUs) (B). The plots depict per-study and adjusted random effects model (REM) log2fold change across all studies for OTUs that were detected in ≥5 studies. All OTUs depicted here had an REM FDR<0.1 and the commonly reported Fusobacterium included as well. The length of the error bar depicts the 95% CIs, and the size of point indicates the precision of the point estimate for individual studies (1/(95% CI upper bound – 95% CI lower bound). The RE model point size is fixed. Blank values indicate that sequences for that specific OTU were not detected in that particular study. Taxonomic identities presented in (A) are genus, species, strain (or OTU ID if strain is unclassified) for SS-UP and phylum, genus, species (or OTU ID if species in unclassified) sequence for QIIME-CR in (B). LogFC, log2fold change.
Fusobacterium sp was detected in seven of the eight CRC-microbiome association studies, but it did not differ consistently between cases and controls. In some studies, little difference was observed, and in others, inverse relationships were detected (ie, abundant in controls relative to cases). The enrichment of Fusobacterium sp in cases relative to controls was observed particularly in the MiSeq studies, leading to an adjusted REM estimate of 1.6 (95% CI 0.04 to 3.2, p=0.04, FDR p=0.4) (see online supplementary table S6A).
Taxa determined significant by the REM were concordant with box-plots of the relative abundance distribution of these taxa across studies; however, sparsely distributed in the comparison groups (see online supplementary figure S3A). The QIIME-CR pipeline also identified multiple OTUs that were consistently enriched or depleted in cases relative to controls, but only a few had high-confidence species-level taxonomic assignments. One such example was an OTU within the genus Porphyrmonas (adjusted REM log2fold estimate across five studies: 2.9, 95% CI 2.0 to 3.9, REM p=2.2×10⁻⁹, FDR p=5.8×10⁻⁷) (see figure 2B and online supplementary table S6B).
A similar REM was built for the four studies that had CRA and controls. The SS-UP pipeline identified 192 OTUs that were detected in either three or all four of the CRA-containing studies. OTUs within the family Lachnospiraceae (OTU1642 adjusted REM estimate: −1.96, 95% CI −2.97 to −0.94, p=1.5×10⁻⁴, FDR=0. 03) and species Bacteroides plebius (adjusted REM estimate: 1.86, 95% CI 0.5 to 3.2, p=0.005, FDR=0.48) were detected in three of the four CRA studies and had a high adjusted REM log2fold change but were not statistically significant after FDR correction. Likewise, the QIIME-CR pipeline produced OTUs within the genera Bacteroides (adjusted REM estimate: −2.9, 95% CI −4.1 to −1.7, p=2.9×10⁻⁶, FDR=0.001) and Ruminococcus (adjusted REM estimate: 1.8, 95% CI 0.6 to 2.9, p=0.003, FDR=0.5) (see online supplementary table S7A and S7B).
As described in the online supplementary methods, to identify a composite microbial biomarker for the disease, we developed RF classifiers for each bioinformatics pipeline. The optimal model was tuned for area under receiver operator characteristic curve (AUROC). For the SS-UP pipeline, microbial markers identified among the eight studies had an AUROC of 80.4% (sensitivity: 60.1%, specificity 84.8%), which was similar to the clinical features-based classifier (AUROC: 79.6%, DeLongs test p=0.76). The SS-UP microbial classifier had improved sensitivity while the clinical classifier had better specificity. The AUROC for the QIIME-CR microbial classifier was 76.6% (sensitivity: 55.3%, specificity: 82.9%) (see online supplementary table S8A and online supplementary figure S3A) For both SS-UP and QIIME-CR, OTUs within P anerobius, Porphyrmonas and Dialister ranked high in variable importance. The top features included in the SS-UP microbial classifier were the previously mentioned P micra, Dialister pneumosintes ATCC 33048, Peptostreptococcus stomatis DSM 17678 and Bacteroides vulgatus ATCC 84842, while the QIIME-CR approach identified Bulleida moorei and Eubacterium dolichum as important. OTUs within genus Fusobacterium were also important in discriminating CRC cases from controls (see online supplementary figure S4).
Using a subset of studies for which both clinical and demographic data were available (n=3 studies, 156 samples),10–12 the microbial-only classifiers for these studies had AUROC values of 80.9% for QIIME-CR and 89.6% for SS-UP. As mentioned above, clinical features alone yielded an AUROC of 79.6% and classifiers including both clinical and microbial features had AUROC values of 82.4% and 91.3% for QIIME-CR and SS-UP, respectively (see figure 3A and online supplementary table S8A).

Microbiome markers from the Strain Select, UPARSE bioinformatics pipeline (SS-UP) pipeline have improved accuracy in colorectal cancer (CRC) classification from a heterogeneous assemblage of samples: (A) depicts ROC curves comparing the SS-UP and QIIME closed reference (QIIME-CR) classifiers of relative abundance-transformed microbial features used to predict CRC. The total cohort microbial-only SS-UP classifier (n=424, area under receiver operator characteristic (AUROC)=80.3%) and the cohort subset for which clinical data were available microbial only model (n=156, AUROC=89.6%) performed better than the total cohort microbial feature only QIIME-CR classifier (n=424, AUROC 76.6%, DeLong's p=0.008) and the cohort subset microbial feature only QIIME-CR classifier (n=156, AUROC=80.6%, DeLong's p=6.8×10⁻⁶). Combined with clinical and demographic markers (age, gender, body mass index, faecal occult blood tests and nationality), SS-UP had a high accuracy in classifying CRC cases (n=156, AUROC, 91.3%). In (B), the leave-one-out analysis is depicted. The random forest classifier of microbial features for the SS-UP pipeline was improved, relative to the all-study inclusive classifier (black, AUROC 80%), by the exclusion of Wu_Zhu_V3_454 (orange, AUROC 84%, DeLong's p=0.005), while the exclusion of Wang_V3_454 (purple, AUROC: 76%, DeLong's p=0.003) reduced the accuracy of the microbial classifier. (C) depicts a study-by-study random forest analysis, as well as the all-study-inclusive SS-UP classifier. Some studies had significantly increased AUROC (Zackular_V4_MiSeq, Wang_V3_454, Zeller_V4_MiSeq DeLong's p<0.01), while the remaining five studies features had a reduced AUROC as compared with all-study-inclusive SS-UP classifier. *Indicates significant difference in the area under the receptor operator characteristic curve (AUROC) between microbial classifier from SS-UP when compared with that of QIIME-CR. ^Indicates significant difference between the microbial and clinical features combined classifiers for the SS-UP and QIIME-CR pipelines.
To determine whether any particular study weighted classifier accuracy, we performed an n−1 analysis and evaluated changes in the classifier performance, relative to performance based on the full set of studies (n=8 studies), as each study was excluded one at a time. Excluding Wang_V3_45414 reduced the accuracy of the classifier the most (from 80.1% to 75.8%), suggesting that it had important features to contribute. Excluding WuZhu_V3_454 improved the overall accuracy of the SS-UP pipeline (AUROC increased from 80.1% to 83.9%), indicating it contributed ‘noisy’ features that detracted from classifying disease outcome (figure 3B). Similar trends were observed for the QIIME-CR analysis (see online supplementary figure S4A, table S8B). We constructed an RF model for each study individually and observed that features identified within a single study with homogenously processed samples frequently had a better ROC, but the sensitivity of the individual study models was often lower than that obtained for the combined classifier (see online supplementary table S8B and online supplementary figure S4B).
To test the generalisability of the classifier, we observed the degree to which an n−1 microbial classifier was able to predict disease outcome in the study that was left out. For example, we considered the n–Chen_V13_454 cohort as the training set and the Chen_V13_454 as the validation set and determined how well disease outcome in the Chen et al cohort was predicted by microbial features from the rest of the studies. We observed that microbial features from the rest of the cohort correctly predicted 36/42 samples (AUROC: 80.5%, accuracy: 84.6%) in Chen_V13_454. The predictive value varied among studies (see online supplementary table S9).
The CRA versus control SS-UP classifier, which combined microbial taxa from four studies, had lower accuracy than the CRC classifier (AUROC: 63.6%) but good sensitivity (80.5%) and low specificity (34.4%). The QIIME-CR CRA microbial classifier had similar metrics (AUROC: 67.4%, sensitivity: 78.3%, specificity: 38.8%). We also attempted to classify CRA versus CRC samples and obtained moderately good classification accuracy (SS-UP AUROC: 73.7%, QIIME AUROC: 80.7%).
Finally, we combined microbial markers from the analyses above for the CRC versus control comparison to identify a common set that was differentially abundant, consistent across studies and important in classification. This list of 25 microbial OTUs from the SS-UP pipeline is highlighted in the online supplementary table S10.
Discussion
Most previously reported microbiome meta-analyses have used a closed-referenced strategy for processing 16S data.20–22 In this study, we assembled a diverse collection of microbiome studies and evaluated both the closed-reference approach and an alternate method of combining open-reference OTU picking and reclassifying de novo OTUs against a reference database. By repositioning raw sequencing data from multiple faecal microbiome studies and analysing it in a uniform manner, we identified microbial markers that were consistently enriched or depleted in CRC. Importantly, we identified novel and previously unreported strains associated with CRC and CRA without the use of shotgun metagenomic sequencing.
Despite the heterogeneity associated with each of the original microbiome studies, the RF classifiers we built were comparable to results reported by Zeller et al 10 (shotgun metagenomic classifier of 22 taxa with an AUROC of 84%), Zackular et al (six taxa with an AUROC of 79%) and Baxter et al41(microbial markers classifying colonic lesions with an AUROC of 84.7%).41 The SS-UP-based classifiers consistently yielded greater sensitivity and specificity, while also producing fewer predictors (ie, OTUs) and tuning variables (mtry) than the QIIME-CR approach. The SS-UP microbial classifier had an accuracy of 80.1%, and the exclusion of the Wu_V3_454 study (n=39) (figure 3B) resulted in a similar AUROC to that of Baxter et al.41 The results obtained from the SS-UP pipeline for models evaluating microbial features (AUROC 89.6%) or microbial features plus FOBT results, age, gender and BMI (AUROC 91.8%) from a subset of studies10–12 were comparable to the combined metagenomic and FOBT classifiers reported by Zeller et al (AUROC of 87%) and Zackular et al (AUROC of 93.6%). Similarly, Baxter et al41 reported a combined classifier based on microbial markers and the faecal immunochemical test (FIT), an alternative screening method to FOBT, to have an AUROC of 95.2%. Therefore, this is the first report of a CRC stool classifier to achieve an AUROC >84% while simultaneously incorporating variation across eight cohorts and multiple laboratory protocols.
Notably, the results of our leave-one-out analysis suggest that the SS-UP classifier was not drastically affected by features unique to any particular study. This demonstrates the stability of microbial markers as a reliable classification tool for CRC. To further establish the generalisability of the SS-UP microbial classifier, when the study that was excluded in the leave-one-out analysis was treated as an external validation cohort, the average prediction AUROC was 71.3% (see online supplementary table S9).
We report an OTU bearing a high degree of similarity to P micra ATCC 33270 to be consistently elevated in CRC cases, as well as ranked highly in the microbial and combined clinical–microbial classifier models. As suggested previously,42 markers of periodontal disease, such as Peptostreptococcus, Porphyromonas and OTUs within Diallister sp, demonstrated high classification power for both pipelines (see online supplementary tables S4A and S5A). Oral pathogens have been described in association with CRC and multiple mechanisms that have been postulated to explain this relationship.42 ,43 The SS-UP pipeline also identified the enrichment of strains within the genus Blautia (eg, Blautia luti DSM14534 and Blautia obeum ATCC 29174), which have been previously implicated in CRC cases26 ,44 and the depletion of potentially beneficial microbes, such as dietary carcinogen-transforming Eubacterium hallii45 (strain DSM 3353) and butyrate-producing Faecalibacterium cf. prausnitzii12 ,27 (strain KLE1255) (see online supplementary table S4A).
Both the SS-UP and QIIME-CR pipelines found Fusobacterium sp, one of the most commonly reported bacterial taxa in CRC studies, to be enriched in CRC cases relative to controls. It was significantly enriched in CRC cases in our differential abundance analyses and ranked high in importance in the combined (clinical+microbial) RF model, both of which were pooled analyses and had the potential to be weighted by two large MiSeq studies. In a per-study analysis, we identified a Fusobacterium OTU with a significantly high log2fold change in those MiSeq studies, which targeted the V3 and/or V4 regions (figure 2), but its relative abundance and distribution was far more variable when compared across all studies (see online supplementary figure S3). This suggests that the detection and reporting of Fusobacterium sp in conjunction with CRC may be dependent on the 16S target region (eg, V3/V4 amplicons) and/or sequencing platform used. Although Fusobacterium sp was enriched in CRC samples, it was not found to be differentially abundant in CRA samples for either pipeline by univariate analysis, REM or RF classification models, indicating that it may be a marker of late(r) stage disease.
CRA or precancerous lesions were not sufficiently distinguished from controls by microbial markers by either bioinformatics pipeline. Although a previously published study reported a combination of five OTUs with an AUROC of 83.9% to differentiate adenoma from controls, another study using a different cohort and 12 microbial taxa resulted in an ROC of 67.3% in the identification of CRA. The combination of microbial and clinical markers appears to provide greater diagnostic utility for CRA than microbial markers alone. Notably, the combination of FIT testing and phylum-level microbial abundances has been reported to have an AUROC of 76.7% to classify CRA.30 Compared with previously published studies, the sensitivity of our microbial marker-only SS-UP classifier was relatively high (75.5%) and could be used to complement an FOBT or FIT tests, which have greater specificity.24 ,30
Our CRA versus CRC classification yielded a better AUROC than the healthy versus CRA comparison in our analysis, or those from other studies.11 ,41 Thus, changes in microbial composition appear to be most apparent in the adenoma–carcinoma transition but not necessarily at polyp initiation. Differential abundance analysis identified some of the same OTUs within Succinovibrio and Clostridia in the comparison of both CRA and CRC cases to controls, and it is possible that these may serve as ‘driver’ species in cancer progression. Whether driver or passenger, these observational studies confirm that microbial dysbiosis is a characteristic feature of CRC and presents a promising target for detection and intervention.
Despite best efforts, our study had limitations. Information regarding cancer stage, tumour location, FOBT results and patient demographics, including age, gender and BMI, was available for only three of the nine studies analysed. Likewise, information regarding adenoma growth patterns (eg, tubular or villous) and cancerous capacity (ie, neoplastic or hyperplastic) was limited. Statistically, differential abundance analyses are sensitive to sparse microbial OTU data (which is a characteristic of microbial taxa distribution) and variation with respect to depth of coverage. We attempted to control for potentially artefactual results by adjusting for confounders and correcting for multiple comparisons.
Despite these limitations, our study assembled and uniformly analysed a diverse set of faecal microbiome CRC data sets, identified key taxa that were consistently elevated in CRC cases and determined a composite set of 16S rRNA gene-based faecal microbial biomarkers for CRC detection, representing a key step forward in the search for a sensitive, specific and non-invasive diagnostic for CRC.
References
Footnotes
Twitter Follow Manasi Shah @GoingByGut
Contributors MSS: Study design, data collection, sequence processing, statistical analysis and manuscript preparation. TDeS: Study design, data collection, sequence processing, statistical analysis and manuscript preparation. TW: Sequence processing and manuscript preparation. PJMcM: Statistical analysis and manuscript preparation. JLC: Sequence processing and manuscript preparation. AA: Statistical analysis and manuscript preparation. J-MY: Statistical analysis and manuscript preparation. EBH: Study design, data collection, sequence processing, statistical analysis and manuscript preparation.
Competing interests MSS worked as a consultant with Second Genome during the course of work. TDeS, TW, PJMcM and AA were employed by Second Genome during the course of the work and hold stock options.
Provenance and peer review Not commissioned; externally peer reviewed.