

ABSTRACT
Objectives: To explore the long-term patterns of foodborne disease outbreaks (FBDOs) in Saudi Arabia between 2017-2023 using longitudinal data analysis models.
Methods: A 7-year longitudinal study was carried out on FBDO data from all 13 regions of Saudi Arabia. This study examined 5 outcomes: the number of FBDOs, FBDO cases, and FBDO cases classified by gender, nationality, and age groups. The analysis used generalized estimating equations and generalized linear mixed models based on a negative binomial distribution.
Results: The findings revealed a significant decrease in FBDO counts and cases from 2017-2020, followed by an increase until 2023. Public sources consistently reported higher numbers of FBDOs and cases than home sources. No substantial difference was observed in FBDO cases between men and women. Saudi nationals had higher FBDO case counts than non-Saudi residents. The age groups 5-19 years and 20-49 years exhibited the highest FBDO case numbers.
Conclusion: The observed patterns, particularly the decline toward 2020 and the subsequent increase, underscore the necessity for adaptable public health strategies to mitigate the heightened incidence following the COVID-19 pandemic in Saudi Arabia and may inform future prevention and control measures.
Studying foodborne disease outbreaks (FBDOs) in Saudi Arabia is crucial for comprehending the epidemiology of foodborne illnesses and developing effective prevention and control measures. Previous studies have reported statistical analyses of specific regions of FBDOs in Saudi Arabia; however, limited information is available on the longitudinal trends of these outbreaks over several years.1,2 Comprehensive data on the longitudinal trends of FBDOs in Saudi Arabia are lacking, which limits our understanding of the epidemiology of foodborne illnesses, particularly before and after the COVID-19 pandemic. This study aimed to address this knowledge gap by comprehensively analyzing the longitudinal trends of FBDOs in Saudi Arabia from 2017-2023.
Longitudinal data analysis is a statistical technique used to study the data collected from the same subjects over time. The subject of this study was the Saudi Arabian region, and data were collected annually from 2017-2023. Longitudinal data analysis has gained significant attention in recent years owing to its ability to capture changes and patterns over time. Deciphering the dynamics of longitudinal data is crucial in various fields, including healthcare, social sciences, and economics as it allows researchers to identify trends and make informed decisions. This study was focused on applying the main statistical methods for longitudinal data analysis: generalized estimating equations (GEE) and generalized linear mixed models (GLMM). The 2 available methods, GEE and GLMM, are popular for analyzing longitudinal data. The GEE is often preferred when interested in population-level trends and when handling missing data or imbalanced repeated measures. In contrast, GLMM is preferred when the emphasis is on subject-specific predictions or when variability among subjects is of particular interest. The appropriate method for FBDO datasets is GEE, because the main goal is the population mean rather than the subject-specific mean. However, GLMM is more effective with a smaller sample size; therefore, this study applied both.3,4 This research intended to investigate the longitudinal trends of FBDOs in Saudi Arabia from 2017-2023 and identify any regional variations in these trends using the GEE and GLMM methods. This study hypothesized a significant increase in the number of FBDOs in Saudi Arabia after the COVID-19 pandemic and a variation in the incidence of these outbreaks across different demographic variables such as gender, nationality, and age groups.
Methods
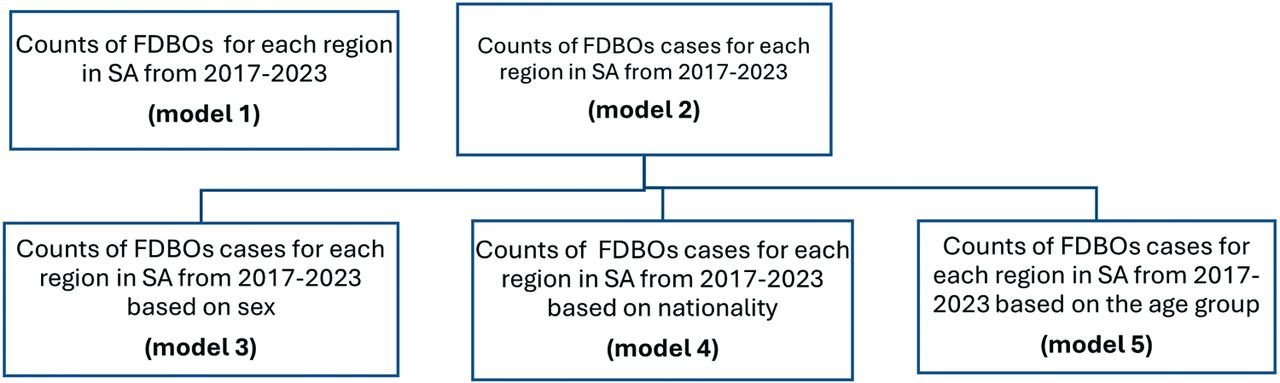
This longitudinal study was carried out on FBDOs in Saudi Arabia. This work comprised counts of FBDOs from 2017-2023 for all regions in Saudi Arabia (13 regions). The annual counts of FBDOs and their cases are announced by the Ministry of Health based on various factors such as age group, gender, source of infection (public or home), and nationality (Saudi or non-Saudi) in each region.5 Missing data is not a concern because the statistics are completely announced. Longitudinal data modeling was carried out for the counts of FBDOs (model 1) and total cases of FBDOs (model 2). The other 3 models (models 3-5) were FBDO cases based on gender, nationality, and age groups, as shown in the flow chart Figure 1.

- The flow chart of the datasets and models are used in the study. FBDOs: foodborne disease outbreaks, SA: Saudi Arabia
In this longitudinal study, the subjects were the regions of Saudi Arabia. The outcome was the count, and 5 major outcomes were modeled over the years, with every outcome in a separate model. Initially, the FBDO outcomes in each region of Saudi Arabia were documented. Subsequently, the counts of FBDO cases for each region in the country and the counts based on gender (male or female), nationality (Saudi Arabia or non-Saudi Arabia), and age groups (<1, 1-4, 5-19, 20-49, and 50+ years) were recorded. Each model had its covariate, the categorical variable, and all outcomes were obtained 7 times from 2017-2023 (Figure 1). The year variable was also a nominal variable from 2017-2023 and was considered nominal for comparing the primary outcomes over the years, with 2017 as the reference year.
Longitudinal analysis of count data is common in epidemiological studies. This type of analysis assumes only non-negative integer values using Poisson distribution. The Poisson random variable Y has the feature E(Y)=V(Y).6 Overdispersion is also a common problem in count data, where E(Y)<V(Y). Negative binomial (NB) is the appropriate choice for modeling the count data, and the random variable follows the mean: E(Y) and V(Y)=E(Y)+a(E(Y))2, where a controls overdispersion.7,8 Moreover, the longitudinal dataset model is a special regression model, a type of regression for correlated datasets.9-11
In the regular regression model, a primary assumption of independence among the dataset subjects is carried out. This assumption is broken in the longitudinal or repeated-measures dataset, where readings are obtained repeatedly from the same subject. In this study, FBDO counts in each region of Saudi Arabia had at least 7 readings from 2017-2023. Regression analysis of correlated datasets accounted for this problem and estimated the valid regression parameters. Subsequently, the longitudinal dataset of FBDO counts from 2017-2023 was analyzed using correlated regression models. The 2 main methodologies used for longitudinal data analysis are marginal and conditional models. Starting with the conditional model, the GLMM is the common model with a random effect part in the regression equation that describes the behavior of the outcome for the same subject, where a region in Saudi Arabia is a subject. This method was focused on interpreting the subject or region. This random effect part accounted for the dependency among the readings of the same subject, and the appropriate link function for the mean was the log function used in the model.10 A total of subjects followed up for t repeated measures and p covariates were considered using a single random intercept representing the differences among the individuals. The regression equation for the count outcome was the differences among the individuals, as follows:

Where b0, b1, b2……bp are the regression coefficients and Zi is the random effect assumed to be normally distributed with a zero mean and estimated variance from the dataset.12,13 The parameters were determined using the maximum likelihood computed using iterative methods. The correlation structure can be assumed to be of different types; in this study, it was assumed to be exchangeable. Model selection was based on the Akaike information criterion, and the smallest was the best.14
In contrast, the strategy and interpretation differ in the marginal model, but the parameter estimations are close. A GEE was used as the marginal model. The GEE focuses on estimating population-averaged parameters, allowing researchers to account for correlations within subjects, while providing robust standard errors. The GEE is a simple method for analyzing longitudinal data without assuming a particular distribution for the data. This method requires only a link function through the mean; in this case, it is a log-link function appropriate for count data and a suitable correlation structure. The model is robust even when the correlation structure is misspecified.10
The GEE model is as follows:

Where b0, b1, b2……bp are the regression coefficients. The “working” correlation matrixes are estimated to adopt the correlation among the subjects’ readings using the iterative method of Newton Raphson. In addition, the correlation structure can be assumed to be of different types. In this case, it was assumed to be exchangeable. Model selection was carried out based on the criteria of Quasi-likelihood (QAIC); the smallest is the best. This method is beneficial when the interest lies in understanding the average effect of covariates across all clusters (all ratings for one region), rather than subject cluster effects.10,11,15
There are certain major differences in the methods proposed to analyze FBDOs. The GLMM suggests that the correlation among the repeated measures comes from the same subject. The shared random effect adopts this problem, followed by inference and covariate effects based on the subject. In the GEE approach, covariate effects are based on population rather than the subject mean. This method may be less effective with smaller sample sizes, leading to high standard deviation (SD) and some bias.4 In the case of FBDO counts from Saudi Arabia, the main goal was to assess the average mean of the population rather than each region, for which GEE is appropriate. However, GLMM was also analyzed to obtain the final results as the findings are similar and both methods are appropriate for longitudinal data.6
Statistical analysis
The SAS software was carried out and descriptive statistics (mean±SD) were calculated for each outcome from 2017-2023.
Results
Foodborne disease outbreak data from 13 regions in Saudi Arabia were analyzed and discussed. Each region was considered a cluster or subject observed from 2017-2023. A total of 5 outcomes were analyzed in 5 separate models to determine the change in FBDO counts over the years 2017-2023 based on 5 factors: counts, cases, gender, nationality, and age groups. For the first outcome (FBDO counts) from home and public sources, the public source mean was 14.69 in 2017, which decreased in 2020 and then increased to 15.31 in 2023, with a high SD of 23.03. The results showed that the mean values of FBDO counts were higher from public sources than home sources. The same trend was observed in the second outcome (counts of FBDO cases), where the mean values were higher from public sources than home sources. The statistics decreased from 2017-2020 and increased until 2023. For the gender variable in outcome 3, the FBDO case counts did not show a clear change between men and women over the years. In contrast, the nationality variable in outcome 4 exhibited higher mean values for Saudi citizens than non-Saudi citizens. The counts of FBDO cases based on age groups indicated that higher mean values for FBDO counts were for the middle groups 5-9 years and 20-49 years. The main point highlighted in Table 1 is that the calculated mean values decreased from 2017-2020 and then increased until 2023. In addition, the SDs were high, which led to the selection of an appropriate distribution to model the outcomes, which was an NB distribution instead of a Poisson distribution.19
- The descriptives statistics for the outcomes of foodborne disease outbreaks through 2017-2023.
In Figure 2, every outcome profile from 2017-2023 is plotted with the interval mean±SD. The mean values decreased until 2020 and then increased until 2023. The FBDO counts and cases were higher from the public source and Saudi cases for the 5-19 and 20-49 age groups. The observed trends in outcome profiles suggested potential impacts from the COVID-19 pandemic, with a notable dip in 2020, followed by a recovery period. This pattern may reflect changes in reporting practices, healthcare access, and actual disease incidence during the pandemic.

- Plots of foodborne disease outbreaks outcomes profiles through 2017-2023 in Saudi Arabia. FBDOS: foodborne disease outbreaks, SE: standard error
Table 2 presents the results of the GEE, and Table 3 provides the findings of the GLMM for the 5 outcomes using an NB distribution for both methods. As mentioned in Table 1, most SDs were high, the variance that doubled the SD was high, and the NB was the appropriate choice for running the models. In Tables 2 & 3, the intercept, covariate parameter estimations b ± standard error (SE), p-values, and relative risk ([RR]=exp[b]) are presented for the GEE and GLMM methods. Model 1 included 2 categorical covariates: source type (public or home) and year. The year was considered a categorical variable, and 2017 was taken as a reference to compare the FBDO count for each year relative to 2017. As inferred from Table 2, the estimation parameter for the home source using the GEE method was -0.29, and the reference was the public source. In contrast, in Table 3, the estimation from the GLMM method was -0.198. In general, the results of the 2 methods were similar, with some differences owing to the sample size.4,20,21 Both methods were employed because the goal of the GEE method is to describe covariate effects on the population means rather than the subject (here, the region), which is more applicable to our FBDO case counts. The RR from the GEE method for the home source was 0.749, which signifies that the estimated RR was 0.749 times higher than that for the public source. The parameter estimations for 2018-2020 decreased significantly and then increased until 2023, compared with the reference year 2017, for both methods, except in 2018 and 2023 for the GEE method (p-values were not significant).
- The generalized estimating equations models, the parameters estimation, p-values and relative risks used in the study.
- The generalized linear mixed models, the parameters estimation, p-values and relative risks used in the study.
For model 2, the outcome was the number of FBDO cases applied to the 2 methods. The results were the same as those for model 1; the RR for the home source was 0.407 times higher than that for the public source, and the parameter estimations for the FBDO case counts decreased significantly toward 2020 and then increased until 2023 relative to the year 2017. The only exception was 2018, which was not significant. For model 3, the gender variable did not significantly affect the number of FBDO cases; all parameter estimations for the years were significant and decreased until 2021 and then increased until 2023. The results of model 4 were similar to those of model 3, but the nationality variable had a significant effect on FBDO cases for Saudi citizens compared with the reference non-Saudi citizens. Finally, model 5 included 2 covariates: age and year. All parameter estimations and RR were significantly higher than those for the reference age group (<1), and the parameter estimation decreased significantly toward 2020 and then increased toward 2023.
Discussion
This comprehensive study examining FBDOs in Saudi Arabia from 2017-2023 has shown significant trends and patterns. Using GEE and GLMM, 5 primary outcomes, namely, the number of FBDOs, FBDO cases, and FBDO cases categorized by gender, nationality, and age, were analyzed. The investigation revealed that public sources consistently reported higher FBDO counts and cases than home sources. In addition, a prominent decline in FBDO counts and cases was observed from 2017-2020, followed by an increase until 2023. The study found no significant disparity in FBDO case counts between men and women; however, Saudi citizens exhibited higher FBDO case counts than non-Saudi residents. The age groups 5-19 and 20-49 demonstrated the highest FBDO case counts. This comprehensive analysis provides valuable insights for public health officials and policymakers in Saudi Arabia to develop targeted interventions and preventive strategies. The observed trends in FBDO counts and cases across demographics highlight the need for tailored approaches to food safety education and regulations.
Study limitations
Despite providing valuable insights into the trends and patterns of FBDOs, this study’s reliance on retrospective surveillance information might have led to potential underreporting or misclassification of incidents, which could have affected the precision of the estimates. Furthermore, the research did not explicitly account for possible confounding factors, such as differences in food safety regulations, reporting methods, and access to healthcare, which might have influenced the observed patterns.
The findings of this study provide valuable insights for improving FBDO surveillance and prevention strategies in Saudi Arabia. Advanced statistical models, such as GEE and GLMM, should be integrated into routine epidemiological analyses to better account for temporal and demographic variations in foodborne illnesses. Moreover, targeted public health interventions, including risk-based food safety regulations, public awareness campaigns, and enhanced inspection protocols, are essential for reducing the outbreak frequency and severity. Future research should explore spatial modeling and climate-related factors to refine risk prediction models and inform proactive food safety policies. Collaboration among health authorities, food industry stakeholders, and policymakers is crucial for implementing evidence-based strategies that mitigate FBDO risks and enhance public health protection. However, further studies should incorporate real-time surveillance data, spatial modeling, and additional covariates to enhance the robustness of the findings. This study recommends further investigation into the factors underlying these trends and the development of tailored interventions for high-risk groups and settings.
In conclusion, these findings emphasize the need for ongoing surveillance and targeted interventions in public food establishments. The observed patterns, especially the decrease toward 2020 and the subsequent increase, underscore the need for adaptable public health strategies to alleviate FBDO counts and cases. This research contributes to an in-depth understanding of foodborne illness epidemiology in Saudi Arabia and can inform future prevention and control measures. The implications of these findings extend beyond Saudi Arabia, potentially offering insights for other countries grappling with similar food safety challenges.
Acknowledgment
The author gratefully acknowledge ContentConcepts (www.contentsconcepts.com) for the English language editing.
Footnotes
Disclosure. Authors have no conflict of interests, and the work was not supported or funded by any drug company.
- Received December 1, 2024.
- Accepted April 8, 2025.
- Copyright: © Saudi Medical Journal
This is an Open Access journal and articles published are distributed under the terms of the Creative Commons Attribution-NonCommercial License (CC BY-NC). Readers may copy, distribute, and display the work for non-commercial purposes with the proper citation of the original work.
References
- 1.
- 2.
- 3.
- 4.
- 5.
- 6.
- 7.
- 8.
- 9.
- 10.
- 11.
- 12.
- 13.
- 14.
- 15.
- 16.
- 17.
- 18.
- 19.
- 20.
- 21.