


Article Figures & Data
Figures
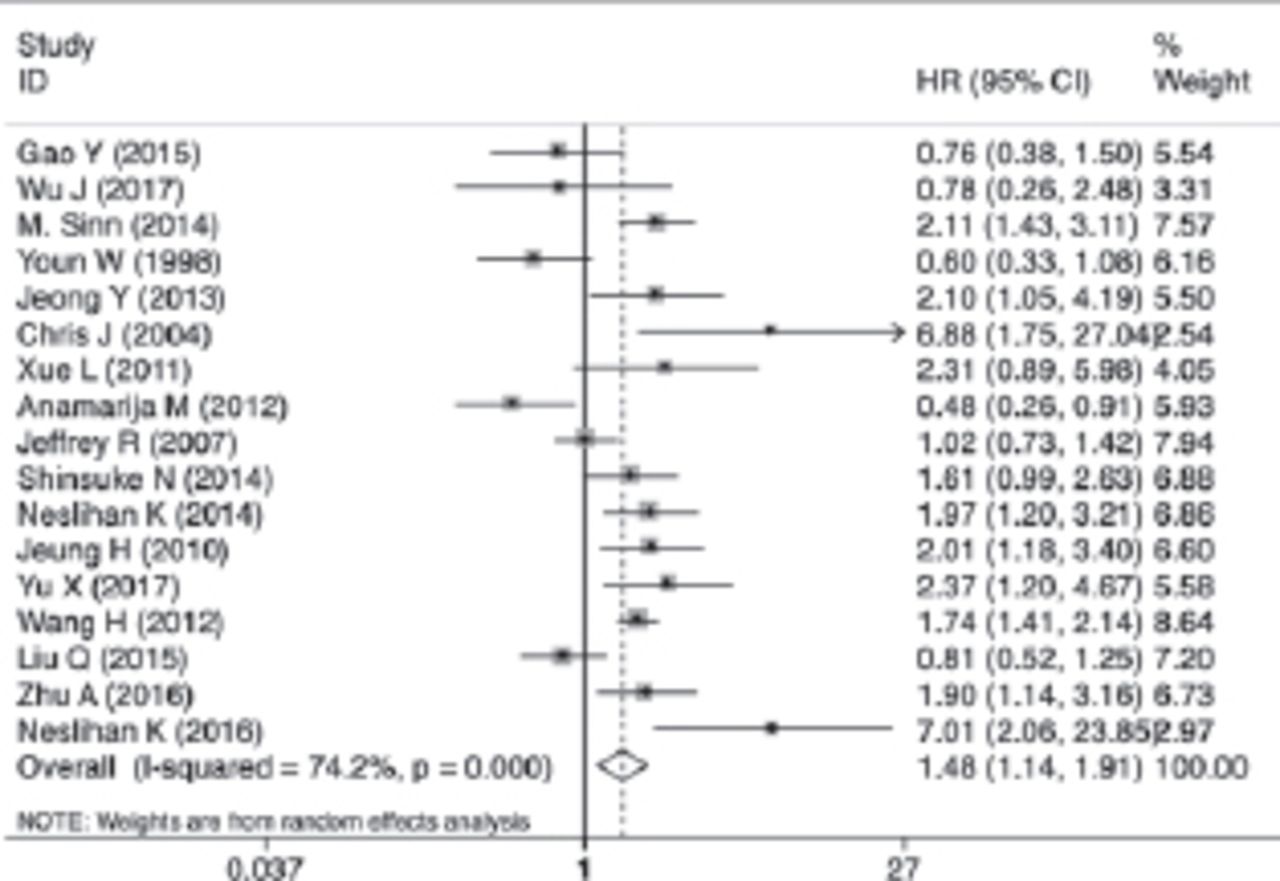
Forest plot of the associations between tumoral secreted protein acidic and rich in cysteine over expression and overall survival in the cancer cell group
Kaplan-Meier curves of the probability of survival over time for all mechanical ventilated patients (adult and pediatric) admitted to the intensive care unit.
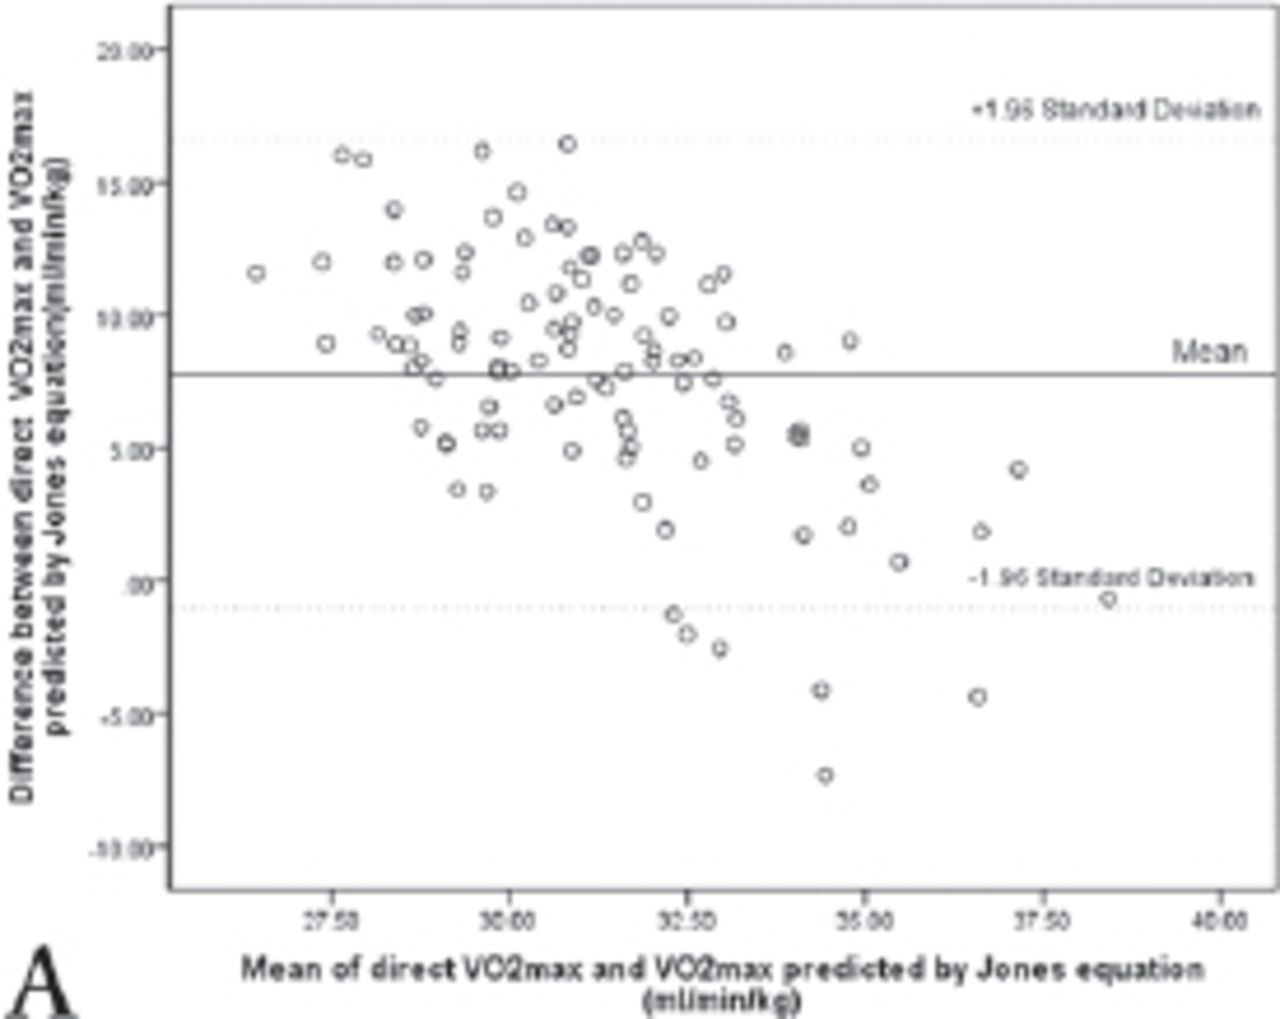
Bland-altman plot showing the difference between actual VO2max and VO2max predicted by Jones.
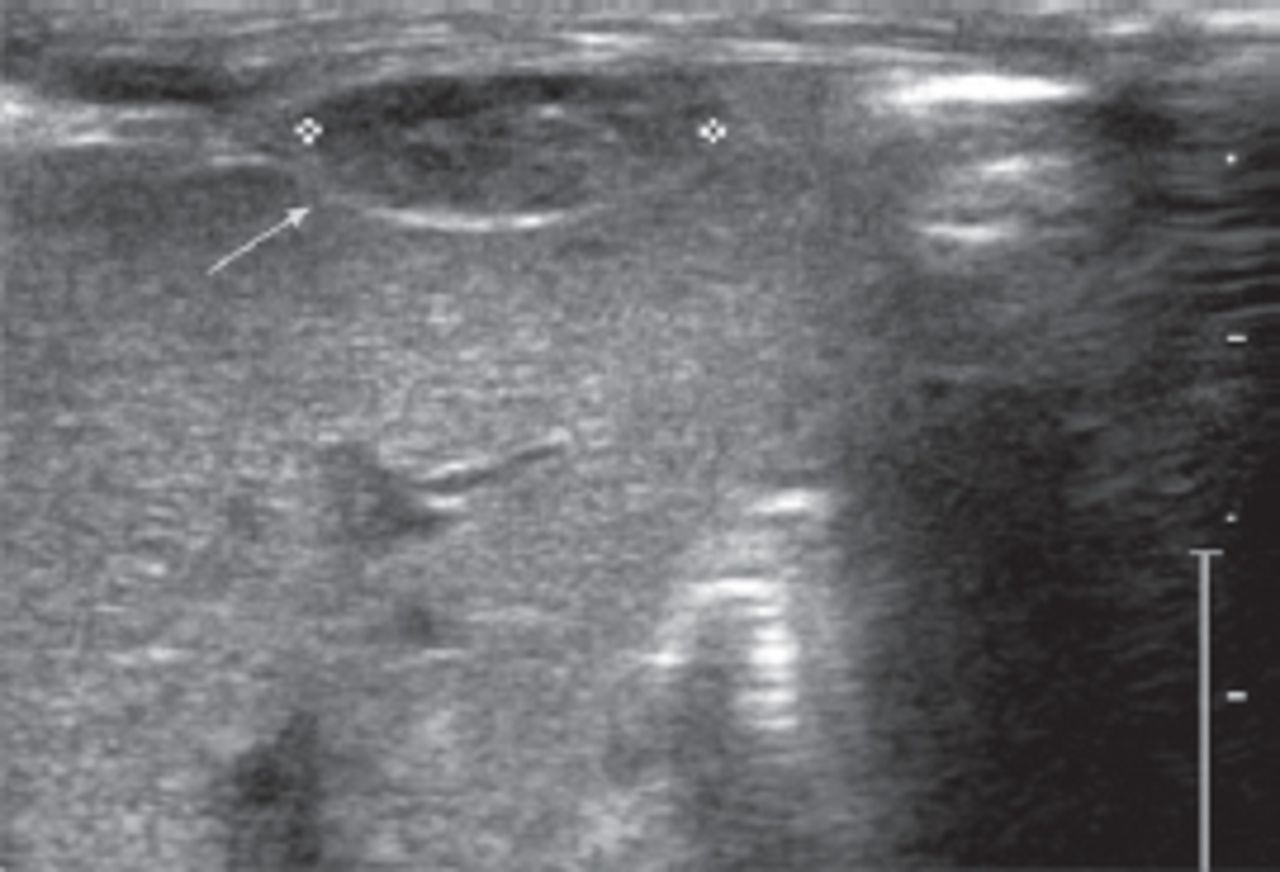
Preoperative abdominal sonography showed a subcapsular liver hematoma of 1.1cm x 0.5cm.


In this issue


Jump to section
Related Articles
Cited By...
- No citing articles found.