


Article Figures & Data
Figures
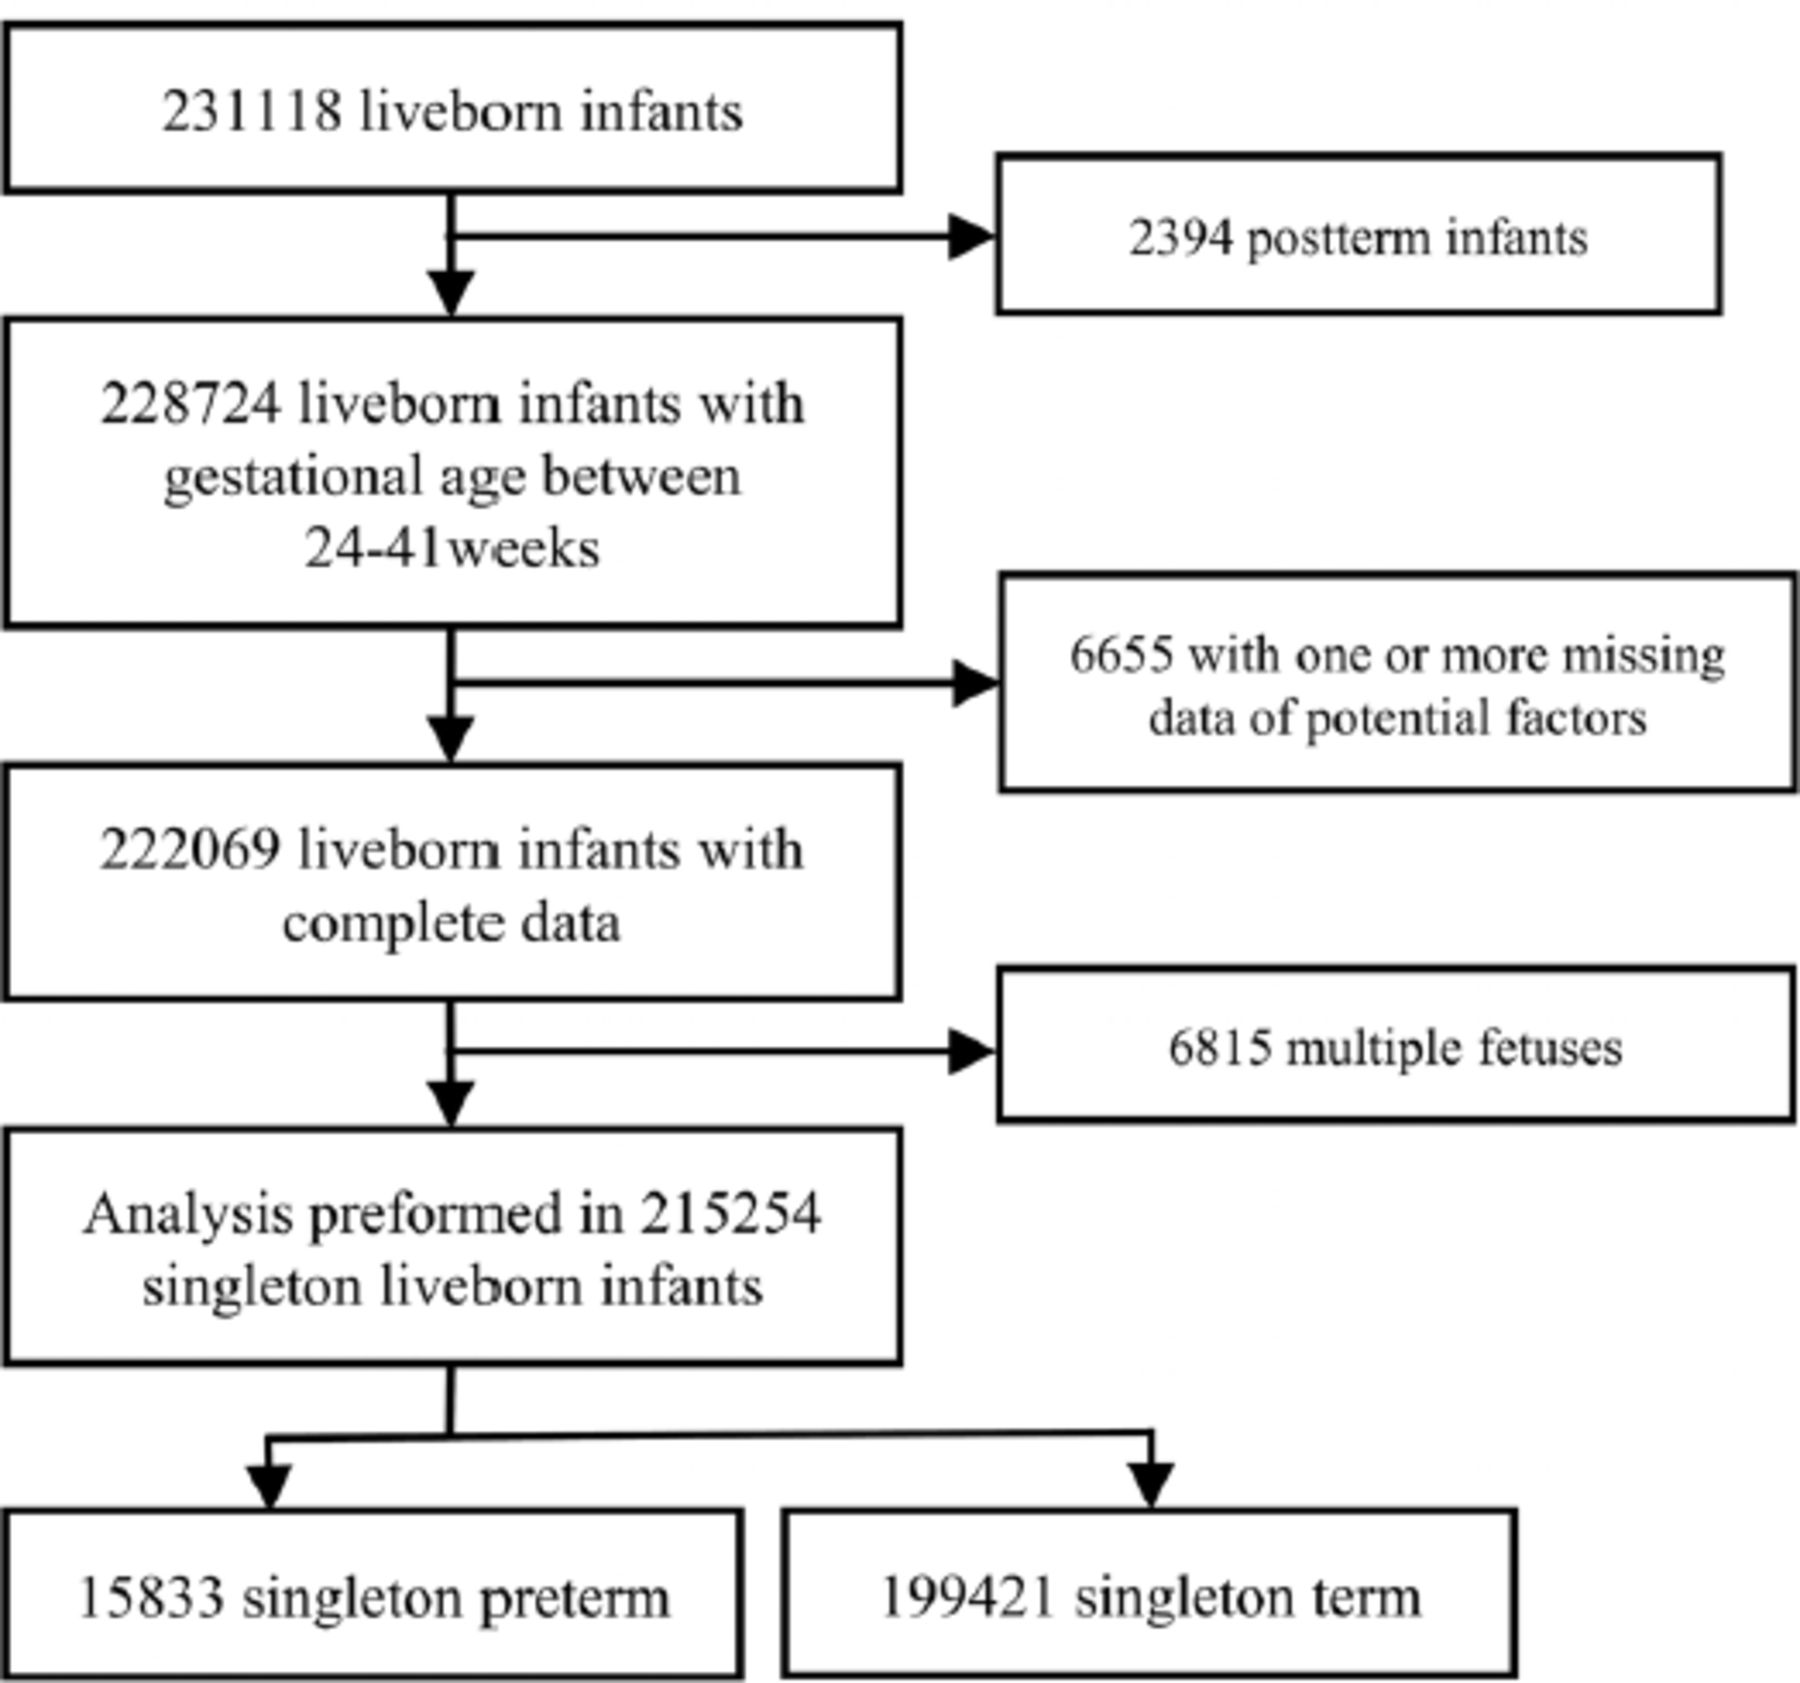
- Figure 1
- Flowchart showing the recruitment process for participants.
Tables
Characteristics Total group (n=215254) Preterm group (n=15833) Term group (n=199421) P-value Gestational age (weeks)* 38±2 34±2 39±1 <0.001 Birth weight (g)* 3262±500 2419±583 3329±4263 <0.001 Male † 114084 (53.0) 9212 (58.0) 105094 (52.7) 0.001 Maternal age (years) † 27.4±4.9 27.7±5.6 27.4±4.8 <0.001 Parity † #x00A0; #x00A0; #x00A0; <0.001 1 149951 (69.7) 9949 (62.8) 140002 (70.2) #x00A0; ≥2 65303 (30.3) 5884 (37.2) 59419 (29.8) #x00A0; Apgar score at 5 min of <7 600 (2.8) 335 (2.1) 265 (1.3) <0.001 - Table 2
- Univariate and multivariate analyses of risk factors for singleton preterm births.
Factors Singleton preterm(n=15833) Singleton term(n=199421) OR (95% CI)* P-value aOR (95% CI) (Model A)† P-value Maternal age (years) #x00A0; #x00A0; #x00A0; #x00A0; #x00A0; <20 609 (3.8) 4584 (2.3) 1.796 (1.647–1.958) <0.001 1.963 (1.796–2.145) <0.001 20–34 13124 (82.9) 177395 (89.0) 1.000 #x00A0; 1.000 #x00A0; ≥35 2100 (13.3) 17442 (8.7) 1.627 (1.550–1.708) <0.001 1.318 (1.250–1.390) <0.001 Parity #x00A0; #x00A0; #x00A0; #x00A0; #x00A0; #x00A0; 1 9949 (62.8) 140002 (70.2) 1.000 #x00A0; 1.000 #x00A0; ≥2 5884 (37.2) 59419 (29.8) 1.393 (1.347–1.441) <0.001 1.423 (1.372–1.476) <0.001 HDP #x00A0; #x00A0; #x00A0; #x00A0; #x00A0; #x00A0; Yes 1007 (6.4) 3486 (1.7) 3.818 (3.552–4.103) <0.001 3.978 (3.691–4.288) <0.001 No 14826 (93.6) 195935 (98.3) 1.000 #x00A0; 1.000 #x00A0; GDM #x00A0; #x00A0; #x00A0; #x00A0; #x00A0; #x00A0; Yes 723 (4.6) 7020 (3.5) 1.311 (1.213–1.418) <0.001 1.216 (1.122–1.319) <0.001 No 15110 (95.4) 192401 (96.5) 1.000 #x00A0; 1.000 #x00A0; ICP #x00A0; #x00A0; #x00A0; #x00A0; #x00A0; #x00A0; Yes 347 (2.2) 973 (0.5) 4.570 (4.039–5.172) <0.001 5.520 (4.860–6.270) <0.001 No 15486 (97.8) 198448 (99.5) 1.000 #x00A0; 1.000 #x00A0; Anemia #x00A0; #x00A0; #x00A0; #x00A0; #x00A0; #x00A0; Yes 288 (1.8) 2407 (1.2) 1.516 (1.341–1.71) <0.001 1.261 (1.108–1.436) <0.001 No 15545 (98.2) 199421 (98.2) 1.000 #x00A0; 1.000 #x00A0; Chorioamnionitis #x00A0; #x00A0; #x00A0; #x00A0; #x00A0; Yes 196 (1.2) 787 (0.4) 3.164 (2.703–3.703) <0.001 2.834 (2.406–3.340) <0.001 No 15637 (98.8) 198634 (99.6) 1.000 #x00A0; 1.000 #x00A0; Placenta previa #x00A0; #x00A0; #x00A0; #x00A0; #x00A0; #x00A0; Yes 284 (1.8) 392 (0.2) 9.27 (7.95–10.81) <0.001 10.09 (8.60–11.83) <0.001 No 15549 (98.2) 199029 (99.8) 1.00 #x00A0; 1.00 #x00A0; Placental abruption #x00A0; #x00A0; #x00A0; #x00A0; #x00A0; Yes 96 (0.6) 66 (0.0) 18.42 (13.46–25.21) <0.001 17.20 (12.35–23.95) <0.001 No 15737 (99.4) 199355 (100.0) 1.000 #x00A0; 1.000 #x00A0; Fetal distress #x00A0; #x00A0; #x00A0; #x00A0; #x00A0; #x00A0; Yes 832 (5.3) 8018 (4.0) 1.324 (1.230–1.425) <0.001 1.249 (1.157–1.348) <0.001 No 15001 (94.7) 191403 (96.0) 1.000 #x00A0; 1.000 #x00A0; Values are presented as number and percentages (%).
↵* OR (odds ratio) value and 95% CI (confidence interval) of univariate logistic analysis model, p<0.05 was considered significant. †aOR (adjusted odds ratio) value and 95% CI after adjusting for other confounders in Model A (including maternal age, parity, HDP, GDM, ICP, anemia, chorioamnionitis, placenta previa, placental abruption, and fetal distress); p<0.05 was considered significant. HDP: hypertension disorders in pregnancy, ICP: intrahepatic cholestasis of pregnancy, GDM: gestational diabetes mellitus
- Table 3 -
Risk factors associated with each preterm subgroup compared to the term group in multinomial multivariate logistic regression analysis.
#x00A0; <32 weeks #x00A0; 32–33 weeks #x00A0; 34–36 weeks #x00A0; Factors aOR (95% CI)* P-value aOR (95% CI)* P-value aOR (95% CI)* P-value Maternal age (years) #x00A0; #x00A0; #x00A0; #x00A0; #x00A0; <20 2.084 (1.650–2.632) <0.001 2.197 (1.810–2.666) <0.001 1.437 (1.289–1.601) <0.001 20–34 1.000 #x00A0; 1.000 #x00A0; 1.000 #x00A0; ≥35 1.396 (1.213–1.606) <0.001 1.167 (1.024–1.330) 0.020 1.204 (1.132–1.280) <0.001 Parity #x00A0; #x00A0; #x00A0; #x00A0; #x00A0; #x00A0; 1 1.000 #x00A0; 1.000 #x00A0; 1.000 #x00A0; ≥2 1.369 (1.238–1.514) <0.001 1.332 (1.220–1.455) <0.001 1.218 (1.169–1.269) <0.001 HDP #x00A0; #x00A0; #x00A0; #x00A0; #x00A0; #x00A0; Yes 3.564 (2.930–4.335) <0.001 4.418 (3.774–5.173) <0.001 3.044 (2.786–3.326) <0.001 No 1.000 #x00A0; 1.000 #x00A0; 1.000 #x00A0; GDM #x00A0; #x00A0; #x00A0; #x00A0; #x00A0; #x00A0; Yes 1.113 (0.886–1.399) 0.358 1.092 (0.893–1.336) 0.392 1.156 (1.054–1.267) <0.001 No 1.000 #x00A0; 1.000 #x00A0; 1.000 #x00A0; ICP #x00A0; #x00A0; #x00A0; #x00A0; #x00A0; #x00A0; Yes 1.384 (0.766–2.499) 0.282 3.056 (2.147–4.348) <0.001 5.763 (5.049–6.577) <0.001 No 1.000 #x00A0; 1.000 #x00A0; 1.000 #x00A0; Anemia #x00A0; #x00A0; #x00A0; #x00A0; #x00A0; Yes 1.240 (0.896–1.715) 0.195 1.582 (1.207–2.074) 0.001 1.096 (0.939–1.279) 0.246 No 1.000 #x00A0; 1.000 #x00A0; 1.000 #x00A0; Chorioamnionitis #x00A0; #x00A0; #x00A0; #x00A0; #x00A0; Yes 11.06 (8.738–14.02) <0.001 3.023 (2.119–4.314) <0.001 2.247 (2.153–2.344) <0.001 No 1.000 #x00A0; 1.000 #x00A0; 1.000 #x00A0; Placenta previa #x00A0; #x00A0; #x00A0; #x00A0; #x00A0; Yes 40.04 (32.00–50.09) <0.001 13.85 (10.28–18.65) <0.001 9.37 (7.77–11.29) <0.001 No 1.000 #x00A0; 1.000 #x00A0; 1.00 #x00A0; Placental abruption #x00A0; #x00A0; #x00A0; #x00A0; #x00A0; Yes 41.52 (25.89–66.58) <0.001 32.06 (20.27–50.70) <0.001 11.67 (7.99–17.02) <0.001 No 1.000 #x00A0; 1.00 #x00A0; 1.00 #x00A0; Fetal distress #x00A0; #x00A0; #x00A0; #x00A0; #x00A0; #x00A0; Yes 1.487 (1.230–1.799) <0.001 1.477 (1.250–1.746) <0.001 1.061 (0.969–1.161) 0.201 No 1.000 #x00A0; 1.000 #x00A0; 1.000 #x00A0; ↵* aOR (adjusted odds ration) value and 95% CI (confidence interval) after adjusting for other confounders in Model B (including maternal age, parity, HDP, GDM, ICP, anemia, chorioamnionitis, placenta previa, placental abruption, and fetal distress). The reference group was the term group. P<0.05 was considered significant. Bold values are significant. Bold numbers are significant. HDP: hypertension disorders in pregnancy, ICP: intrahepatic cholestasis of pregnancy, GDM: gestational diabetes mellitus
- Table 4 -
Risk factors associated with each spontaneous preterm subgroup compared to the term group in multinomial multivariate logistic regression analysis.
#x00A0; <32 weeks #x00A0; 32–33 weeks #x00A0; 34–36 weeks #x00A0; Factors aOR (95% CI)* P-value aOR (95% CI)* P-value aOR (95% CI)* P-value Maternal age (years) #x00A0; #x00A0; #x00A0; #x00A0; #x00A0; #x00A0; <20 1.088 (0.757–1.564) 0.649 1.328 (1.004–1.756) 0.047 0.950 (0/868–1.163) 0.950 20–34 1.000 #x00A0; 1.000 #x00A0; 1.000 #x00A0; ≥35 1.585 (1.357–1.851) <0.001 1.299 (1.127–1.498) <0.001 1.252 (1.166–1.343) <0.001 Parity #x00A0; #x00A0; #x00A0; #x00A0; #x00A0; #x00A0; 1 1.000 #x00A0; 1.000 #x00A0; 1.000 #x00A0; ≥2 1.391 (1.237–1.563) <0.001 1.391 (1.258–1.453) <0.001 1.218 (1.161–1.278) <0.001 HDP #x00A0; #x00A0; #x00A0; #x00A0; #x00A0; #x00A0; Yes 8.518 (7.099–10.221) <0.001 7.924 (6.797–1.538) <0.001 4.303(3.917–4.727) <0.001 No 1.000 #x00A0; 1.000 #x00A0; 1.000 #x00A0; GDM #x00A0; #x00A0; #x00A0; #x00A0; #x00A0; #x00A0; Yes 1.185 (0.922–1.523) 0.184 1.293 (1.047–1.596) 0.017 1.286 (1.162–1.424) <0.001 No 1.000 #x00A0; 1.000 #x00A0; 1.000 #x00A0; ICP #x00A0; #x00A0; #x00A0; #x00A0; #x00A0; #x00A0; Yes 1.384 (0.766–2.499) 0.282 3.875 (2.595–5.786) <0.001 10.04(8.79–11.47) <0.001 No 1.000 #x00A0; 1.000 #x00A0; 1.000 #x00A0; Anemia #x00A0; #x00A0; #x00A0; #x00A0; #x00A0; #x00A0; Yes 1.240 (0.896–1.715) 0.195 1.862 (1.392–2.489) 0.001 1.221 (1.027–1.452) 0.240 No 1.000 #x00A0; 1.000 #x00A0; 1.000 #x00A0; Chorioamnionitis #x00A0; #x00A0; #x00A0; #x00A0; #x00A0; #x00A0; Yes 33.30 (27.29–40.63) <0.001 3.863 (2.620–5.694) <0.001 1.835 (1.405–2.397) <0.001 No 1.000 #x00A0; 1.000 #x00A0; 1.000 #x00A0; Placenta previa #x00A0; #x00A0; #x00A0; #x00A0; #x00A0; #x00A0; Yes 36.75 (26.02–51.92) <0.001 22.71 (16.36–31.517) <0.001 16.05 (13.29–19.36) <0.001 No 1.000 #x00A0; 1.000 #x00A0; 1.00 #x00A0; Placental abruption #x00A0; #x00A0; #x00A0; #x00A0; #x00A0; #x00A0; Yes 63.75 (37.49–108.4) <0.001 49.59 (30.66–80.21) <0.001 17.31 (11.76–25.48) <0.001 No 1.000 #x00A0; 1.00 #x00A0; 1.00 #x00A0; Fetal distress #x00A0; #x00A0; #x00A0; #x00A0; #x00A0; #x00A0; Yes 1.735 (1.414–2.130) <0.001 1.654 (1.378–1.986) <0.001 1.016 (1.050–1.286) 0.004 No 1.000 #x00A0; 1.000 #x00A0; 1.000 #x00A0; ↵* aOR (adjusted odds ration) value and 95% CI (confidence interval) after adjusting for other confounders in Model B (including maternal age, parity, HDP, GDM, ICP, anemia, chorioamnionitis, placenta previa, placental abruption, and fetal distress); the reference group was the term group. P<0.05 was considered significant. Bold values are significant. HDP: hypertension disorders in pregnancy, ICP: intrahepatic cholestasis of pregnancy, GDM: gestational diabetes mellitus
- Table 5
- Risk factors associated with each iatrogenic preterm subgroup compared to the term group in multinomial multivariate logistic regression analysis.
#x00A0; <32 weeks #x00A0; 32–33 weeks #x00A0; 34–36 weeks #x00A0; Factors aOR (95% CI)* P-value aOR (95% CI)* P-value aOR (95% CI)* P-value Maternal age (years) #x00A0; #x00A0; #x00A0; #x00A0; #x00A0; #x00A0; <20 2.103 (1.663–2.660) <0.001 2.221 (1.826–2.701) <0.001 1.449 (1.299–1.615) <0.001 20–34 1.000 #x00A0; 1.000 #x00A0; 1.000 #x00A0; ≥35 1.390 (1.207–1.600) <0.001 1.161 (1.018–1.324) 0.027 1.198 (1.126–1.274) 0.001 Parity #x00A0; #x00A0; #x00A0; #x00A0; #x00A0; #x00A0; 1 1.000 #x00A0; 1.000 #x00A0; 1.000 #x00A0; ≥2 1.331 (1.238–1.514) <0.001 1.287 (1.177–1.406) <0.001 1.181(1.133–1.231) <0.001 HDP #x00A0; #x00A0; #x00A0; #x00A0; #x00A0; #x00A0; Yes 3.405 (2.799–4.143) <0.001 4.176 (3.566–4.892) <0.001 2.900 (2.655–3.168) <0.001 No 1.000 #x00A0; 1.000 #x00A0; 1.000 #x00A0; GDM #x00A0; #x00A0; #x00A0; #x00A0; #x00A0; #x00A0; Yes 1.119 (0.889–1.408) 0.339 1.098 (0.896–1.347) 0.368 1.162 (1.059–1.274) 0.001 No 1.000 #x00A0; 1.000 #x00A0; 1.000 #x00A0; ICP #x00A0; #x00A0; #x00A0; #x00A0; #x00A0; #x00A0; Yes 1.280 (0.709–2.312) 0.413 2.775 (1.949–3.950) <0.001 5.299 (4.646–6.044) <0.001 No 1.000 #x00A0; 1.000 #x00A0; 1.000 #x00A0; Anemia #x00A0; #x00A0; #x00A0; #x00A0; #x00A0; #x00A0; Yes 1.235 (0.891–1.711) 0.204 1.575 (1.199–2.070) 0.001 1.092 (0.935–1.275) 0.269 No 1.000 #x00A0; 1.000 #x00A0; 1.000 #x00A0; Chorioamnionitis #x00A0; #x00A0; #x00A0; #x00A0; #x00A0; #x00A0; Yes 11.89 (9.391–15.07) <0.001 3.317 (2.319–4.743) <0.001 2.025 (1.630–2.516) <0.001 No 1.000 #x00A0; 1.000 #x00A0; 1.000 #x00A0; Placenta previa #x00A0; #x00A0; #x00A0; #x00A0; #x00A0; #x00A0; Yes 3.786 (1.682–8.523) 0.001 1.228 (0.305–4.940) 0.773 2.276 (1.398–3.706) 0.001 No 1.000 #x00A0; 1.000 #x00A0; 1.00 #x00A0; Placental abruption #x00A0; #x00A0; #x00A0; #x00A0; #x00A0; #x00A0; Yes 23.68 (10.21–654.9) <0.001 11.236 (23.52–35.87) <0.001 2.404(0.755–7.654) 0.138 No 1.000 #x00A0; 1.00 #x00A0; 1.00 #x00A0; Fetal distress #x00A0; #x00A0; #x00A0; #x00A0; #x00A0; #x00A0; Yes 1.487 (1.230–1.799) <0.001 1.479 (1.263–1.779) <0.001 1.071 (0.978–1.173) 0.141 No 1.000 #x00A0; 1.000 #x00A0; 1.000 #x00A0; ↵* aOR (adjusted odds ration) value and 95% CI (confidence interval) after adjusting for other confounders in Model B (including maternal age, parity, HDP, GDM, ICP, anemia, chorioamnionitis, placenta previa, placental abruption, and fetal distress); the reference group was the term group. P<0.05 was considered significant. Bold values are significant. HDP: hypertension disorders in pregnancy, ICP: intrahepatic cholestasis of pregnancy, GDM: gestational diabetes mellitus.
Variables <32 weeks(n=1703) 32–33 weeks(n=2345) 34–36 weeks(n=11785) 37–41 weeks(199421) P-value* Maternal age (years) #x00A0; #x00A0; #x00A0; #x00A0; <0.001 <20 83 (4.9) 123 (5.2) 403 (3.4) 4584 (2.3) #x00A0; 20–34 1345 (79.0) 1915 (81.7) 9864 (83.7) 177395 (89.0) #x00A0; ≥35 275 (16.1) 307 (13.1) 1518 (12.9) 17442 (8.7) #x00A0; Parity ≥ 2 704 (41.3) 905 (38.6) 4275 (36.3) 59419 (29.8) <0.001 HDP 119 (7.0) 182 (7.8) 706 (6.0) 3486 (1.7) <0.001 GDM 76 (4.5) 100 (4.3) 547 (4.6) 7020 (3.5) <0.001 ICP 12 (0.7) 38 (1.6) 297 (2.5) 1973 (0.5) <0.001 Anemia 37 (2.2) 61 (2.6) 190 (1.6) 2407 (1.2) <0.001 Chorioamnionitis 48 (2.8) 35 (1.5) 113 (1.0) 787 (0.4) <0.001 Placenta previa 47 (2.8) 46 (2.0) 191 (1.6) 6392 (0.2) <0.001 Placental abruption 24 (1.4) 26 (1.1) 46 (0.4) 66 (0.0) <0.001 Fetal distress 124 (7.3) 166 (7.1) 542 (4.6) 80718 (4.0) <0.001 Values are presented as number and percentages (%).
↵* P-value indicates results of χ2 test comparing proportions of the distribution of risk factors for preterm subgroups. HDP: hypertension disorders in pregnancy, ICP: intrahepatic cholestasis of pregnancy, GDM: gestational diabetes mellitus
In this issue


Jump to section
Related Articles
Cited By...
- No citing articles found.