


Article Figures & Data
Figures
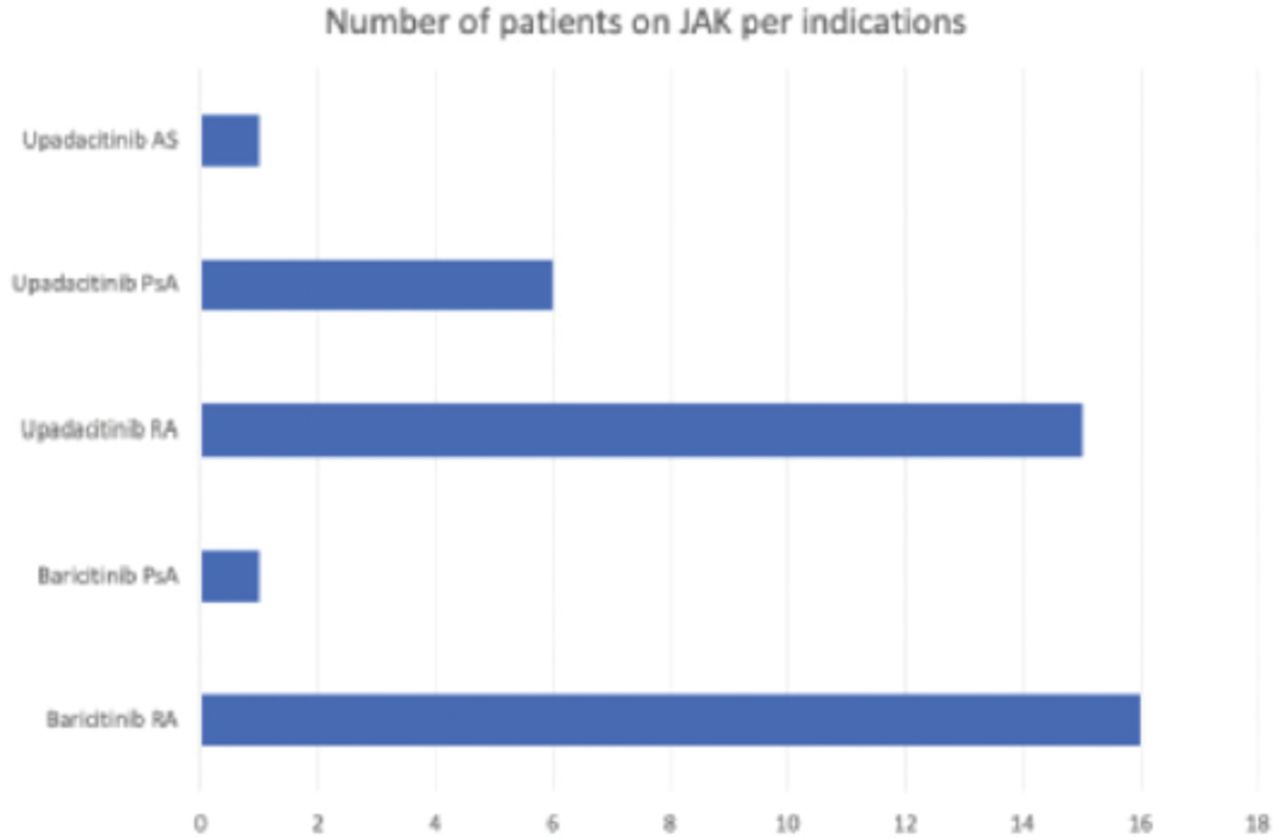
- Figure 1
- Frequency of JAK prescription per diagnosis.
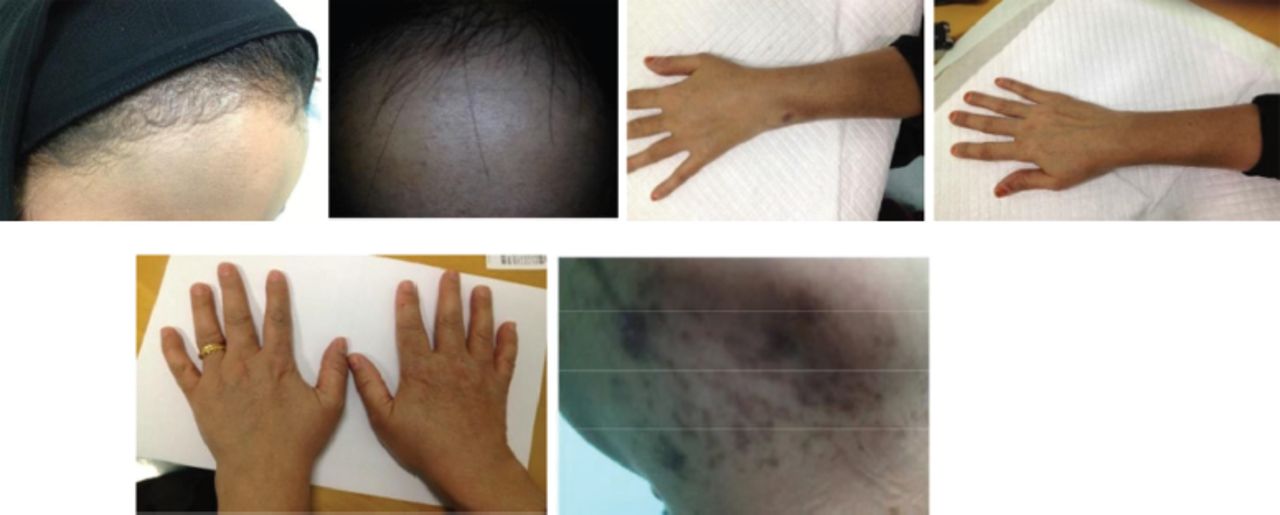
- Figure 1
- Most affected areas of patients with SLE and HCQ-induced hyperpigmentation (the face predominantly [the front & cheeks], hands, upper back, and submandibular area).
- Figure 1
- Average age in years of the cohort involved in the study, including controls without rheumatoid arthritis (RA) or osteoarthritis (OA), patients with RA, and those with OA.
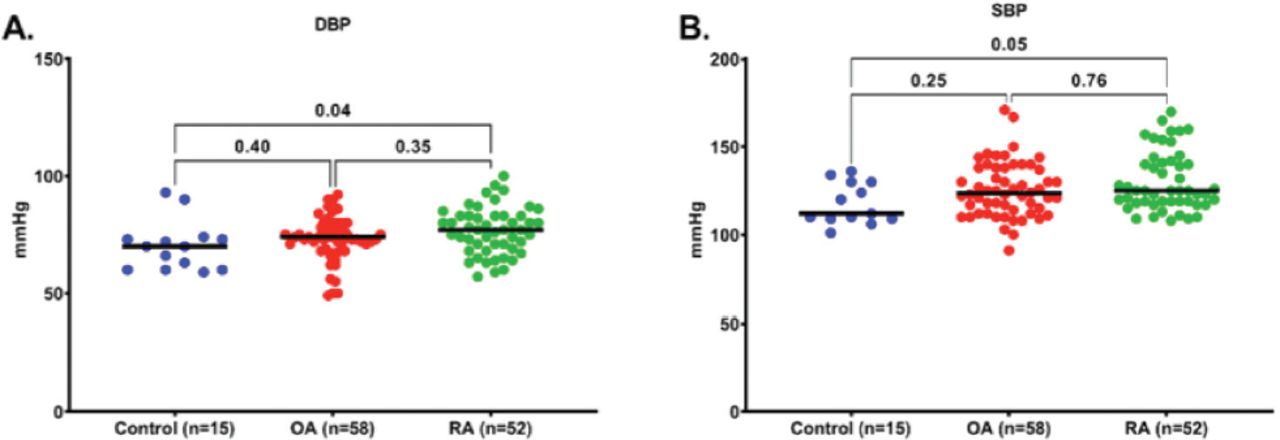
- Figure 2
- Average DBP (A) and SBP (B) in mmHg of the cohort involved in the study, including controls without rheumatoid arthritis (RA) or osteoarthritis (OA), patients with RA, and those with OA. The Kruskal-Wallis test and Dunn’s multiple comparison test were used for statistical analysis.
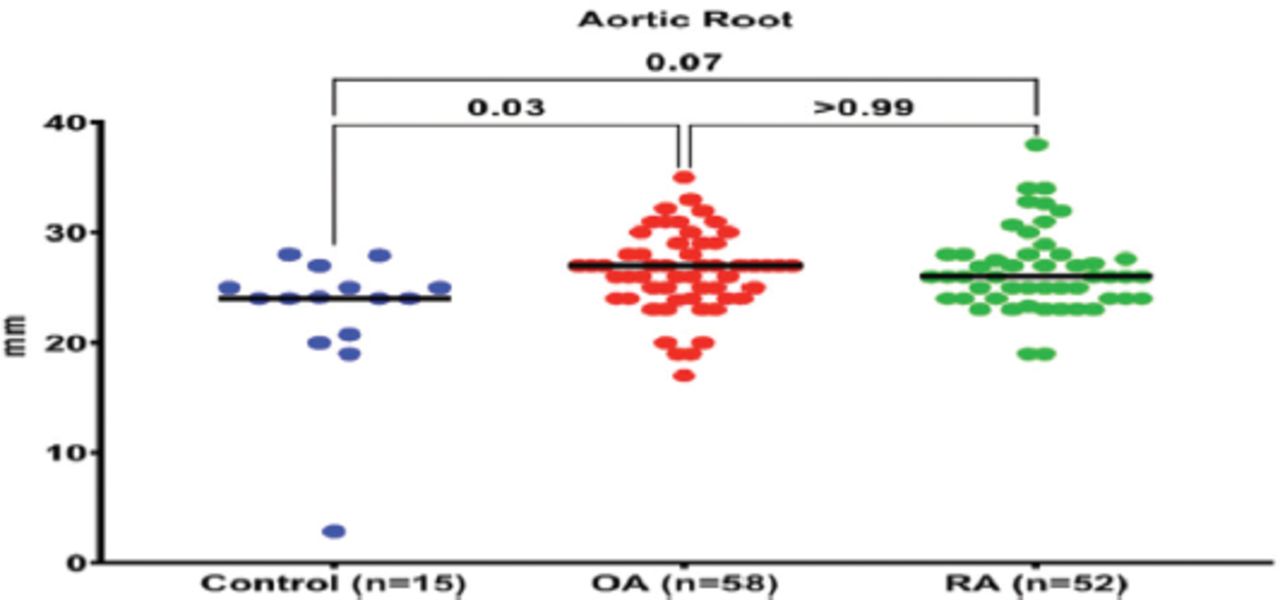
- Figure 3
- Average arotic root diameter in mm of the cohort involved in the study, including controls without rheumatoid arthritis (RA) or osteoarthritis (OA), patients with RA, and those with OA. The Kruskal-Wallis test and Dunn’s multiple comparison test were used for statistical analysis.
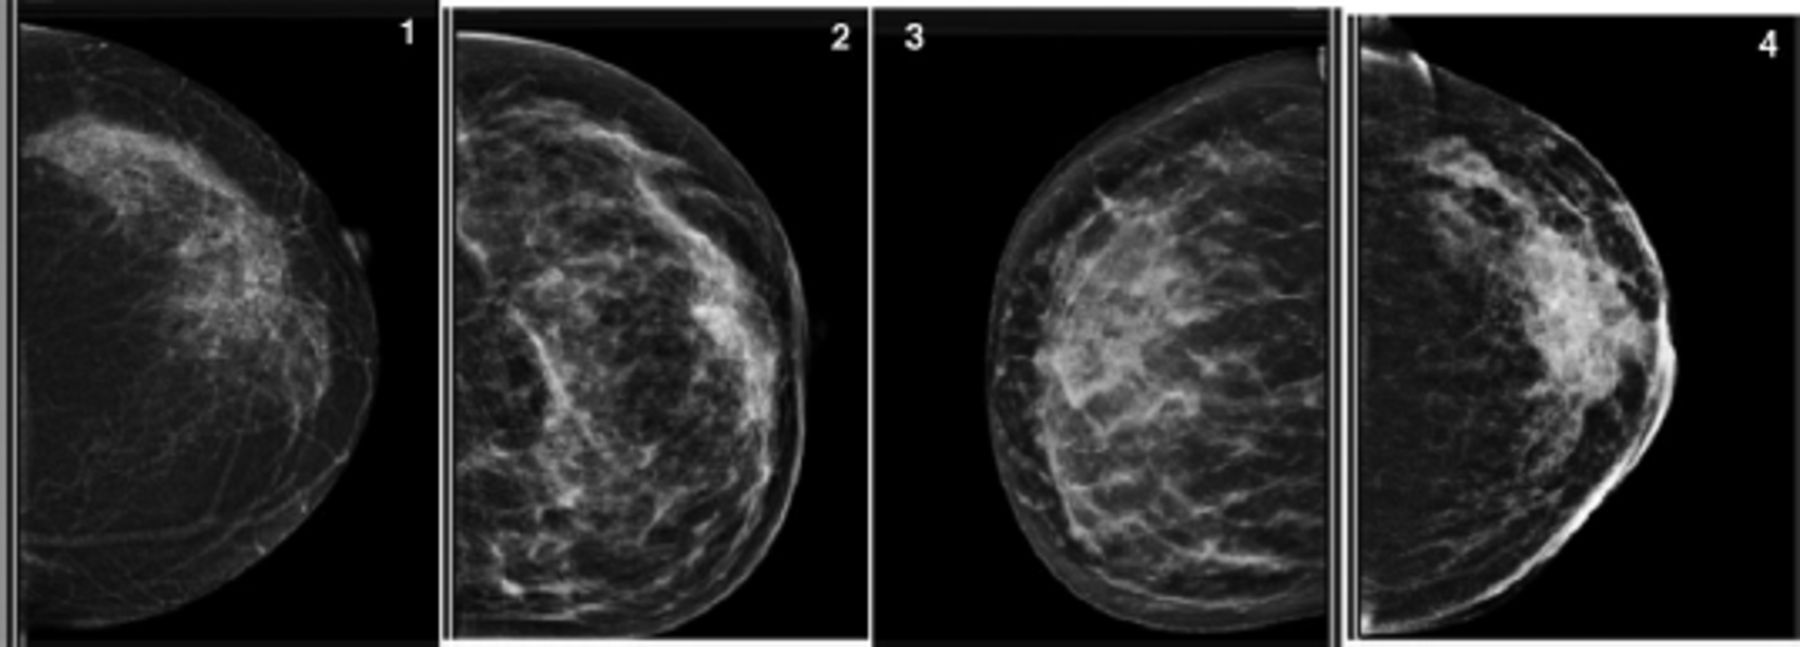
- Figure 1
- Mammograms of al 4 cases.
- Figure 2
- Ultrasound images.
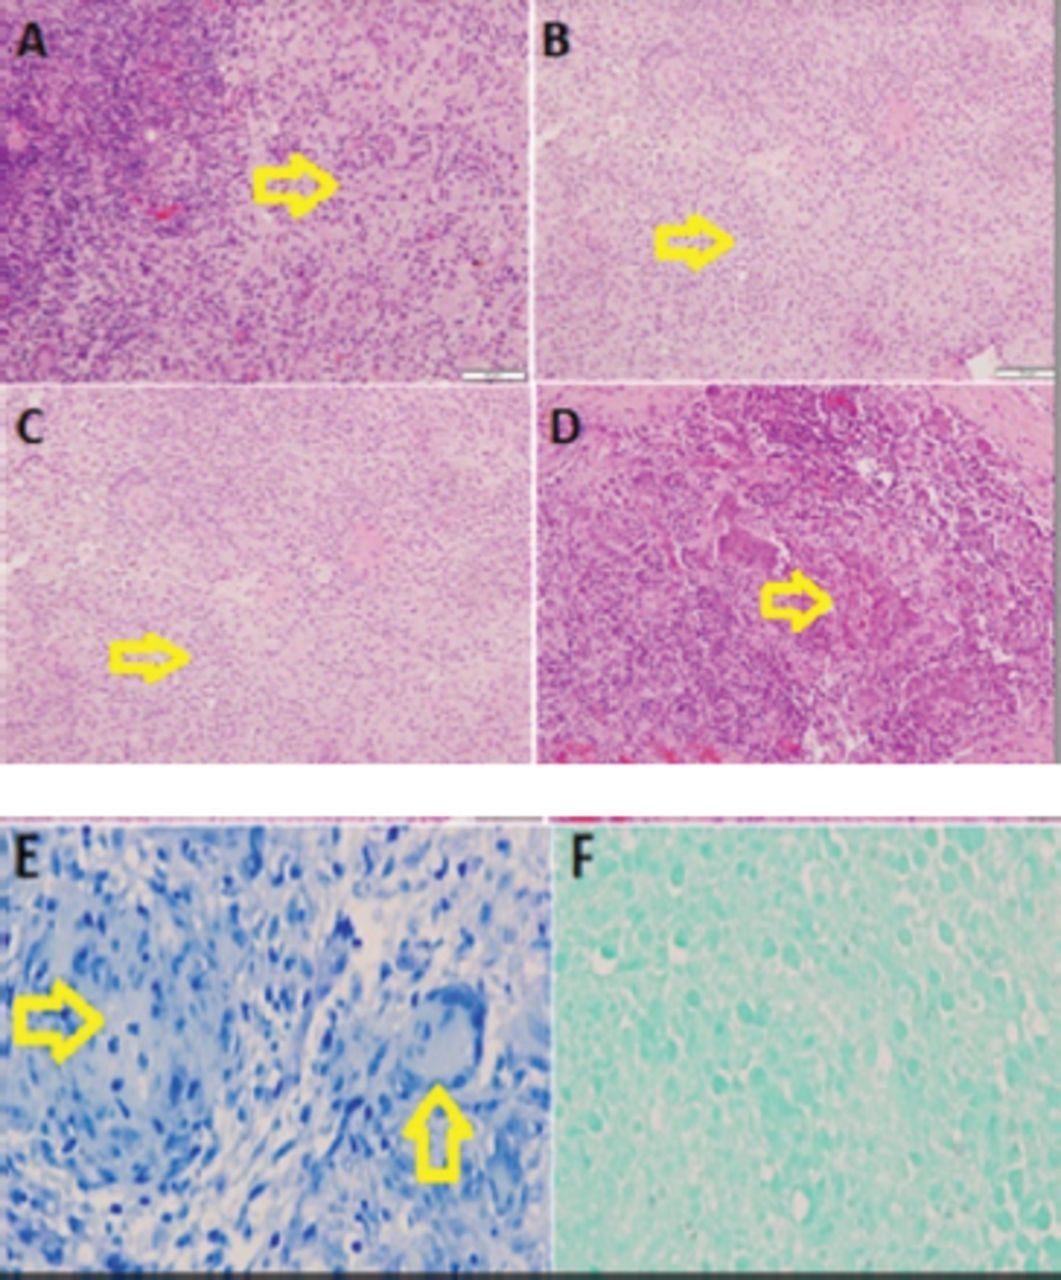
- Figure 3
- Histopathology samples. A,B,C, and D) Shows infiltration of breast lobules by epithelioid non-caseating granuloma. E) Non-caseating granuloma with negative Zeil-Neelson stain for acid fast bacilli. F) Non-caseating granuloma with negative Grocott (methanmine) silver stain for fungi.
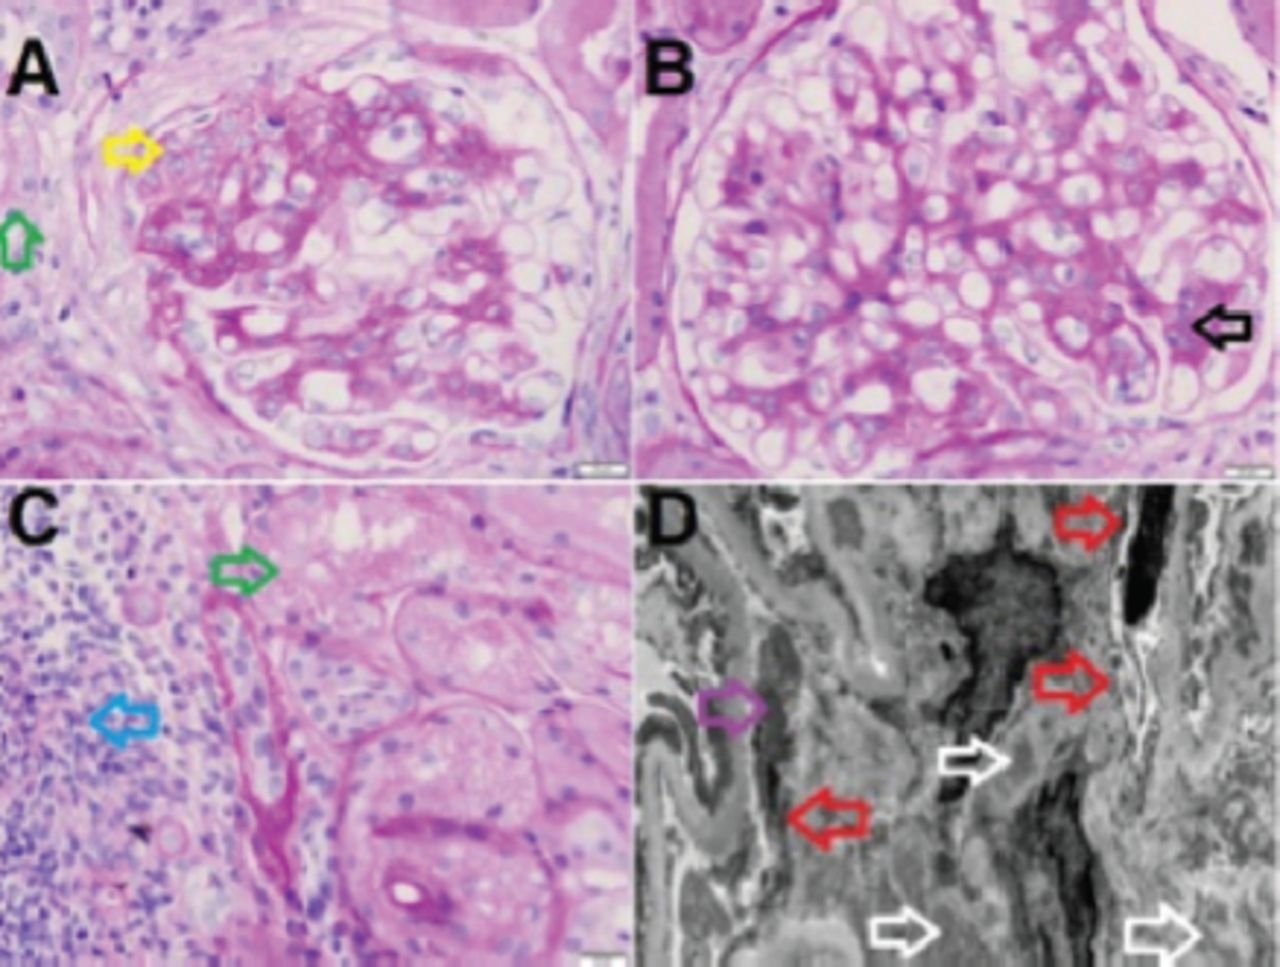
- Figure 1
- A glomerulus with segmental endocapillary proliferation (yellow arrow). A) There is focal acute tubular injury (green arrow). B) Show a glomerulus with mesangial expansion and segmental mild increase in mesangial cells (black arrow). C) Show focal acute tubular injury (green arrow) and interstitial inflammatory cells consisting of lymphocytes mainly (Blue arrow). D) Show electron microscopic changes consist of mesangial electron dense deposits (white arrows), subendothelial deposits (red arrows) and intracapillary hyaline thrombus (purple arrow).
- Figure 1
- An MRI of the brain. A) Case 1. B) Case 2.


Tables
- Table 1.1
- Differences in the characteristics between patients receiving the 2 JAK inhibitors.
Characteristics Baricitinib Upadacitinib Mean age (range) years 62 (30-82) 57 (30-92) DAS 28 CRP remission (total) 41.0% 19.0% DAS 28 CRP remission (current) 88.0% 44.0% Boolean response % (total) 41.0% 9.0% Boolean response % (current) 88.0% 22.0% Mean (range) time before stop (months) 10.1 (3-24) 4.6 (2-9) Mean (range) time on drug 21 (16-32) 10.1 (4-20) Biological-DMARDs naive 82.0% 46.0% Biological-DMARDs failure 18.0% 54.0% Age >50 88.0% 68.0% % of ≥2 CV risk in >50 29.0% 9.0% Side effects Baricitinib Upadacitinib Herpes Zoster 1 1 VTE 0 1 MAC 0 0 Sepsis 1 1 Transaminitis 0 1 Others 1 gastritis 1 hair loss, 1 acne Total 3 (17.0%) 6 (27.0%) Characteristics n (%) ANA 31 (100) dsDNA 31 (100) Low complements (C3 and C4) 31 (100) Arthritis (MCPs, wrists, and knees) 16 (51.6) Leucopenia (<3000×109/L) 31 (100) Thrombocytopenia (<100,000×109/L) 8 (25.8) Painful mouth ulcers 10 (32.2) Fatigue 31 (100) Photosensitivity (acute/chronic) 29 (93.5) Demographic details n (%) Male:female 3:35* Mean age (range), years 50 (21-87) Rheumatoid arthritis characteristics, mean±SD Tender joint count (n=53) 20±15 Swollen joint count (n=44) 18±6 Health assessment questionnaire score (maximum disability 24) 3.3±3.5 Physician’s global assessment of disease activity (maximum 100) 35±23 Joint pain (VAS, maximum 100) 40±29 Morning stiffness duration (minutes) 120±90 Rheumatoid factor level (IU/ml) 240±433 Disease activity score-28 (4v) 5.0±1.4 Rheumatoid factor positive 30 (79.0) RA nodules 1(3.0) Other extra-articular features 0 (0.0) Comorbidities Ever smoking 1 (3.0) Current smoking 0 (0.0) Hypertension 9 (31.0) Diabetes mellitus 4 (11.0) Hyperlipidemia 7 (18.0) Other comorbidities 0 (0.0) Values are presented as numbers and precentages or mean ± standard deviation (SD).
↵* ratio. RA: rheumatoid arthritis
Characteristics Right lobule Left lobule Presence of nodule One nodule 8 (21.0) 7 (18.0) ≥3 nodules 7 (18.0) 6 (16.0) Size of the nodules (mm), mean±SD* 3.53±11.26 to 3.88±12.54 0.57±1.27 to 1.39±4.096 Nature of nodules Complex 6 (40.0) 2 (15.0) Solid 8 (53.0) 9 (70.0) Cystic nodule 1 (7.0) 2 (15.0) Nodules borders Definite borders 12 (80.0) 11 (85.0) Irregular borders 3 (20.0) 2 (5.0) Echotexture Heterogenous 4 (10.0) 6 (16.0) Homogenous 34 (90.0) 32 (84.0) Vascularity hypervascularity 5 (13.0) 6 (16.0) Macrocalcification 1 (3.0) 5 (13.0) Microcalcification 0 (0.0) 1 (3.0) Values are presented as numbers and precentages (%). SD: standrad deviation
- Table 1
- Carotid intima media thickness of 100 RA patients and 154 age-gender matched control subjects.
Subclinical atherosclerosis Controls RA patients P-values CI cIMT (mm), mean±SD 0.56±0.09) 0.60±0.14 0.03 0.56-0.60 Carotid atheroma, n (%) 6 (4.0%) 21 (21.0) 0.00 Values are presented as mean ± standrad deviation (SD) or numbers and precentages (%). CI: confidence interval, mm: millimeter, cIMT: carotid intima media thickness, RA: rheumatoid arthritis
- Table 2
- Demography and comorbidities of 100 RA patients and 154 age-gender matched control subjects.
Variables Control RA patients P-values CI Participants, n 154 100 - - Male:female ration 31 (20.0): 123 (80.0) 16 (16.0): 84 (84.0) 0.41 - Age (years), mean±SD 49±13 47±16 0.23 47-50 Males mean age (years), mean±SD 52±15 52±19 0.93 47-57 Female mean age (years), mean±SD 49±13 46±15 0.21 46-49 Extra-articular manifestations RA nodules 0 (0.0) 5 (5.0) 0.01* - Interstitial lung disease 0 (0.0) 7(7.0) 0.00* - Raynaud’s phenomenon 3 (2.0) 21 (21.0) 0.00* - Eye scleritis or uveitis 0 (0.0) 3 (3.0) 0.03* - Vasculitis 0 (0.0) 1 (1.0) 0.21 - Iron deficiency anemia 11 (7.0) 18 (18.0) 0.03* - Comorbidities Smoking, ever 15 (10.0) 8 (8.0) 0.09 - DM 21(27.0) 12(12.0) 0.09 - Hypertension 23 (29.0) 17 (17.0) 0.39 - Dyslipidemia 24 (36.0) 14 (14.0) 0.01* - Sickle cell or thalassemia 2 (1.0) 0 (0.0) 0.25 - Thyroid disease 7 (4.5) 5 (5.0) 0.65 - Hyperthyroidism 1 (0.6) 0 (0.0) - - Hypothyroidism 6 (4.0) 5 (5.0) - - Values are presented as numbers and precentages (%) or mean ± standrad deviation (SD). RA: rheumatoid arthritis, CI: confidence interval, DM: diabetes mellitus
- Table 3
- Physical examination and weight parameters of 100 RA patients and 154 age-gender matched control subjects.
Parameters Control RA patients P-values CI Blood pressure Sbp (mmHg) 125±17 130±20 0.04 125.04-129.96 Dbp (mmHg) 72±11 76±13 0.04 71.90-75.19 Weight parameters Height (cm) 156.02 156.86 0.68 154.39-158.25 Weight (kg) 77.97±20.07 75.24±20.54 0.34 74.07-79.62 Body surface area 4.39±14.27 1.78±26 0.12 1.78-5.01 BMI (kg/Ht [m]2) 31.54±6.93 29.92±6.30 0.1 29.92-31.84 Values are presented as mean ± standrad deviation (SD). CI: confidence interval, Sbp: systolic blood pressure, Dbp: diastolic blood pressure, BMI: body mass index
- Table 4
- Laboratory values of 100 RA patients and 154 age-gender matched control subjects.
Laboratory values Controls RA patients P-values CI Antibodies profile ANA, n (%) 7 (4.5) 8 (8.0) 0.29 - RF positivity, n (%) 4 (3.0) 72 (72.0) 0.00* - RF level 8.48±8.06 50.61±115.22 0.00* 14.65-41.25 Anti-CCP level, n (%) 0 (0.0) 46 (46.0) 0.00* - Thyroid function test FT4 (pmol/L) 15.59±3.61 15.557±2.63 0.94 15.11-16.05 FT3 (pmol/L) 4.57±1.04 4.36±0.817 0.24 4.31-4.67 TSH (mlU/L) 2.02±1.56 2.98±4.48 0.03* 1.96-2.84 Thyroglobulin 29.13±38.08 56.53±118.65 0.21 17.29-57.83 TPO 135.47±303.37 47.92±75.29 0.14 52.21-161.72 Blood rheology RBC (10(6)/mcL) 4.70±0.51 4.54±0.61 0.04* 4.56-4.71 Hb (g/dl) 12.49±1.61 12.26±1.44 0.28 12.19-12.61 HCT (%) 38.36±4.65 37.78±4.13 0.33 37.53-38.72 MCV(fL) 82.35±9.29 84.51±8.03 0.07 82.06-84.45 MCH (pg) 27.22±4.86 27.36±3.09 0.8 26.71-27.84 MCHC (g/dL) 32.37±1.78 32.33±1.19 0.84 32.15-32.57 RDW 14.34±2.29 14.93±2.79 0.09 14.24-14.93 Plt (103/mcL) 262.35±70.93 287.64±87.63 0.02* 262.47-283.75 MPV 9.42±1.44 8.67±1.23 0.00* 8.91-9.29 WCC (103/mcL) 6.83±1.91 8.21±3.29 0.00* 7.06-7.78 Neutrophil count (%) 53.78±11.78 58.31±12.39 0.01* 54.06-57.34 Neutrophil absolute (103/mcL) 3.76±1.74 4.96±2.58 0.00* 3.97-4.56 Lymphocyte count (%) 35.27±10.19 31.57±10.88 0.01* 32.28-35.13 Lymphocyte absolute (103/mcL) 2.32±0.68 2.41±0.947 0.36 2.25-2.47 Monocyte count (%) 7.42±3.14 7.12±1.90 0.43 6.93-7.66 Monocyte absolute (103/mcL) 0.51±0.21 0.58±0.23 0.02* 0.51-0.57 Eosinophil count (%) 0.19±0.13 0.19±0.13 0.92 0.17-0.21 Eosinophil absolute (103/mcL) 0.19±0.13 0.21±0.16 0.65 0.18-0.22 Basophil count (%) 0.49±0.38 0.44±0.31 0.26 0.43-0.52 Basophil absolute (103/mcL) 0.03±0.04 0.04±0.03 0.52 0.03-0.04 Inflammatory markers ESR (mm/hr) 23.78±17.53 32.75±25.66 0.00* 24.69-30.57 CRP (mg/dl) 4.81±6.59 16.66±34.09 0.00* 6.68-13.17 Renal function Creatinine (mmol/L) 61.10±34.69 60.08±22.94 0.8 56.58-64.76 Urea (mmol/L) 4.88±6.26 4.01±1.69 0.2 3.86-5.18 Uric acid (µmol/L) 290.56±90.69 265.74±106.62 0.07 266.45-293.29 eGFR (ml/min) 96.70±11.67 86.71±28.64 0.25 85.25-101.79 Urine microalbumin level 21.12±110.05 4.87±17.79 0.25 -2.22, 25.32 Glucose status Glucose fasting (mmol/L) 5.96±1.52 6.93±4.71 0.04* 5.89-6.82 HbA1C (mmol/mol) 6.20±1.14 6.76±1.85 0.03* 6.14-6.65 Liver function test Total protein 74.62±5.79 72.65±6.20 0.02* 72.96-74.63 Albumin 39.91±4.73 38.48±4.71 0.03* 38.65-39.96 Bilirubin (total) 10.65±7.41 9.89±4.68 0.4 9.45-11.21 ALT 26.30±22.26 23.08±16.04 0.25 22.19-27.67 Alkaline phosphatase 72.85±24.18 71±21.79 0.57 68.86-75.26 Electrolytes Calcium 2.32±0.13 2.29±0.12 0.25 2.29-2.33 Phosphates 1.17±0.16 1.12±0.21 0.2 1.10-1.18 Magnesium 0.81±0.06 0.76±0.01 0.03* 0.77-0.82 Iron study Ferritin (ng/ mL) 64.81±117.47 75.73±77.19 0.54 52.06-87.95 Iron (µmol/L) 11.03±5.61 10.75±5.35 0.78 9.89-11.91 Transferrin (mg/dl) 257.01±85.61 269.87±55.87 0.36 249.65-277.87 Lipid profile Cholesterol (mmol/L) 4.56±1.02 4.67±1.08 0.44 4.46-4.75 Triglycerides (mmol/L) 1.24±0.66 1.32±0.76 0.41 1.17-1.37 HDL (mmol/L) 1.36±0.73 1.31±0.46 0.56 1.25-1.43 LDL (mmol/L) 2.76±0.96 2.70±0.92 0.69 2.59-2.87 Other tests Vitamin D (nmol/l) 69.26±36.91 54.82±33.62 0.01* 58.34-68.88 Values are presented as mean ± standrad deviation (SD).
RA: rheumatoid arthritis,
CI: confidence interval, ANA: antinuclear antibodies, anti-DNAase: anti-double strand antibodies,
RF: rheumatoid factor, anti-CCP: anti-citrullinated peptide, ASMA: anti-smooth muscles antibody,
anti Scl 70: anti-scleroderma 70, anti-RNP: anti-ribonuclear protein, anti-Sm: anti Smith antibody,
FT: free thyroxine, Ft3: free triiodothyronine, TPO: thyroid peroxidase, RBC: red blood cells (106/mcL),
Hb: hemoglobin (g/dl), Hct: hematocrit, MCV: mean cell volume (fL), MCH: mean cell hemoglobin (pg),
MCHC: mean cell hemoglobin concentration (32-36 g/dL), RDW: red cell distribution width, Plt: platelet (103/mcL), MPV: mean platelet volume (9.4-12.3 fL), WCC: white cell counts (103/mcL), ESR: erythrocytes sedimentation rate (mm/min), CRP: C-reactive protein (mg/dl), eGFR: estimated glomerular filtration rate (ml/min),
HbA1C: glycosylated hemoglobin (mmol/mol), ALT; alanine transferase (IU/L), HDL: high density,
LDL: low density lipoprotein (mmol/L)
↵* P-value of <0.05.
Risk factors Diagnosis P-values Total Co OA RA Count Raw Column Count Raw Column Count Raw Column Count Raw Column Atherosclerotic disease No 118 100% 94.40% 15 12.70% 100% 54 45.80% 93.10% 49 41.50% 94.20% NS Yes 7 100% 5.60% 0 0.00% 0.00% 4 57.10% 6.90% 3 42.90% 5.80% Hypertension No 88 100% 70.40% 15 17.00% 100% 41 46.60% 70.70% 32 36.40% 61.50% 0.01 Yes 37 100% 29.60% 0 0.00% 0.00% 17 45.90% 29.30% 20 54.10% 38.50% Dyslipidemia No 90 100% 72.00% 13 14.40% 86.70% 39 43.30% 67.20% 38 42.20% 73.10% NS Yes 35 100% 28.00% 2 5.70% 13.30% 19 54.30% 32.80% 14 40.00% 26.90% Sjogren No 120 100% 96.00% 15 12.50% 100% 55 45.80% 94.80% 50 41.70% 96.20% NS Yes 5 100% 4.00% 0 0.00% 0.00% 3 60.00% 5.20% 2 40.00% 3.80% Raynaud’s No 121 100% 96.80% 15 12.40% 100% 57 47.10% 98.30% 49 40.50% 94.20% NS Yes 4 100% 3.20% 0 0.00% 0.00% 1 25.00% 1.70% 3 75.00% 5.80% Hypothyroidism No 110 100% 88.00% 14 12.70% 93.30% 52 47.30% 89.70% 44 40.00% 84.60% NS Yes 15 100% 12.00% 1 6.70% 6.70% 6 40.00% 10.30% 8 53.30% 15.40% Diabetes mellitus No 90 100% 72.00% 12 13.30% 80.00% 41 45.60% 70.70% 37 41.10% 71.20% NS Yes 35 100% 28.00% 3 8.60% 20.00% 17 48.60% 29.30% 15 42.90% 28.80% Other chronic disease No 80 100% 64.00% 11 13.80% 73.30% 37 46.30% 63.80% 32 40.00% 61.50% NS Yes 45 100% 36.00% 4 8.90% 26.70% 21 46.70% 36.20% 20 44.40% 38.50% Values are presented as numbers and precentages (%). Co: controls, OA: osteoarthritis, RA: rheumatoid arthritis
Variables Diagnosis Co OA RA Total P-values LV septum in diastole (mm) 8.75±1.36 9.70±2.00 9.35±2.02 9.42±1.96 NS LV post wall in diastole (mm) 8.62±1.24 9.27±1.71 9.44±2.14 9.26±1.86 NS LV end-diastolic diameter (mm) 40.1±6.6 42.9±5.0 43.6±6.8 42.8±6.1 NS LV end-systolic diameter (mm) 24.6±4.3 26.6±3.9 27.1±5.5 26.6±4.7 NS LV mass (g) 105.3±33.4 133.7±34.6 137.6±58.2 131.8±46.6 NS EF (%) 68.8±5.3 67.8±6.4 67.1±8.1 67.7±7.0 NS Deceleration time (ms) 183±31 191±55 184±47 187±49 NS E (cm/s) 80.7±12.5 74.4±16.8 77.1±18.1 76.3±16.9 NS E/A 1.43±0.37 1.16±0.40 1.28±0.47 1.25±0.43 NS E’ (cm/s) 12.13±2.57 10.29±3.24 11.44±3.59 11.00±3.36 NS E/E’ 6.81±1.88 7.76±2.17 7.13±2.05 7.38±2.10 NS RV function (TAPSE, mm) 20.3±2.8 20.0±4.0 21.2±3.1 20.5±3.5 NS Aortic root (mm) 22.7±6.1 26.4±3.6 26.5±3.7* 26.0±4.2* 0.005 Pulmonary pressure (mmHg) 10±12 11±9 9±9 10±9 NS Values are presented as mean ± standrad deviation (SD). Results are based on 2-sided tests assuming equal variances. For each significant pair, the key of the smaller category appears in the category with the larger mean.
↵* The significant level of 0.05 (adjusted for all pairwise comparisons within a row of each innermost subtable using the Bonferroni correction.
Variables Diagnosis Co OA RA Total P-values Count Row Column Count Row Column Count Row Column Count Row Column LV mass index (g/m2) 1 6 9.8% 40.0% 28 45.9% 50.9% 27 44.3% 54.0% 61 100% 50.8% NS 2 0 0.0% 0.0% 1 33.3% 1.8% 2 66.7% 4.0% 3 100% 2.5% 3 0 0.0% 0.0% 2 33.3% 3.6% 4 66.7% 8.0% 6 100% 5.0% 4 9 18.0% 60.0% 24 48.0% 43.6% 17 34.0% 34.0% 50 100% 41.7% Grade of DD 0 10 14.9% 66.7% 29 43.3% 52.7% 28 41.8% 56.0% 67 100% 55.8% NS 1 2 5.6% 13.3% 20 55.6% 36.4% 14 38.9% 28.0% 36 100% 30.0% 2 3 17.6% 20.0% 6 35.3% 10.9% 8 47.1% 16.0% 17 100% 14.2% Aortic regurgitation 0 15 13.9% 100% 52 48.1% 94.5% 41 38.0% 82.0% 108 100% 90.0% 0.039 1 0 0.0% 0.0% 3 25.0% 5.5% 9 75.0% 18.0% 12 100% 10.0% Aortic stenosis 0 15 12.6% 100% 55 46.2% 100% 49 41.2% 98.0% 119 100% 99.2% NS 1 0 0.0% 0.0% 0 0.0% 0.0% 1 100% 2.0% 1 100% 0.8% Mitral valve prolapse 0 15 13.0% 100% 51 44.3% 92.7% 49 42.6% 98.0% 115 100% 95.8% NS 1 0 0.0% 0.0% 4 80.0% 7.3% 1 20.0% 2.0% 5 100% 4.2% Mitral regurgitation 0 15 13.0% 100% 51 44.3% 92.7% 49 42.6% 98.0% 115 100% 95.8% NS 1 0 0.0% 0.0% 4 80.0% 7.3% 1 20.0% 2.0% 5 100% 4.2% Mitral stenosis 0 15 12.7% 100% 54 45.8% 100% 49 41.5% 98.0% 118 100% 99.2% NS 1 0 0.0% 0.0% 0 0.0% 0.0% 1 100% 2.0% 1 100% 0.8% Tricuspid regurgitation 0 13 12.1% 86.7% 48 44.9% 87.3% 46 43.0% 92.0% 107 100% 89.2% NS 1 2 15.4% 13.3% 7 53.8% 12.7% 4 30.8% 8.0% 13 100% 10.8% Values are presented as numbers and precentages (%). Results are based on nonempty rows and columns in each innermost subtable. The Chi-square statistic is significant at 0.05 level. Co: controls, OA: osteoarthritis, RA: rheumatoid arthritis
Characteristics n (%) Age, mean±SD 40.8±15.7 Female 162 (82.0) Disease duration (years), mean±SD 6.3±6.6 Time to diagnosis (years), mean±SD 3.5±5.4 Diagnosis Rheumatoid arthritis 151 (76.0) Systemic lupus erythematosus 22 (11.0) Juvenile idiopathic arthritis 6 (3.0) Scleroderma 4 (2.0) Mixed connective tissue disease 3 (2.0) Psoriatic arthritis 3 (2.0) Spondyloarthropathy 3 (2.0) Polymyositis 1 (1.0) Dermatomyositis 1 (1.0) Still’s disease 1 (1.0) Chronic recurrent multifocal osteomyelitis 1 (1.0) Behcet’s disease 1 (1.0) Gout 1 (1.0) Use of DMARD theraphy (n=146) Monotherapy 73 (50.0) Dual therapy 51 (35.0) Triple therapy 11 (8.0) Biologic 11 (8.0) Values are presented as numbers and precentages (%).
In this issue


Jump to section
Related Articles
Cited By...
- No citing articles found.