


Article Figures & Data
Figures
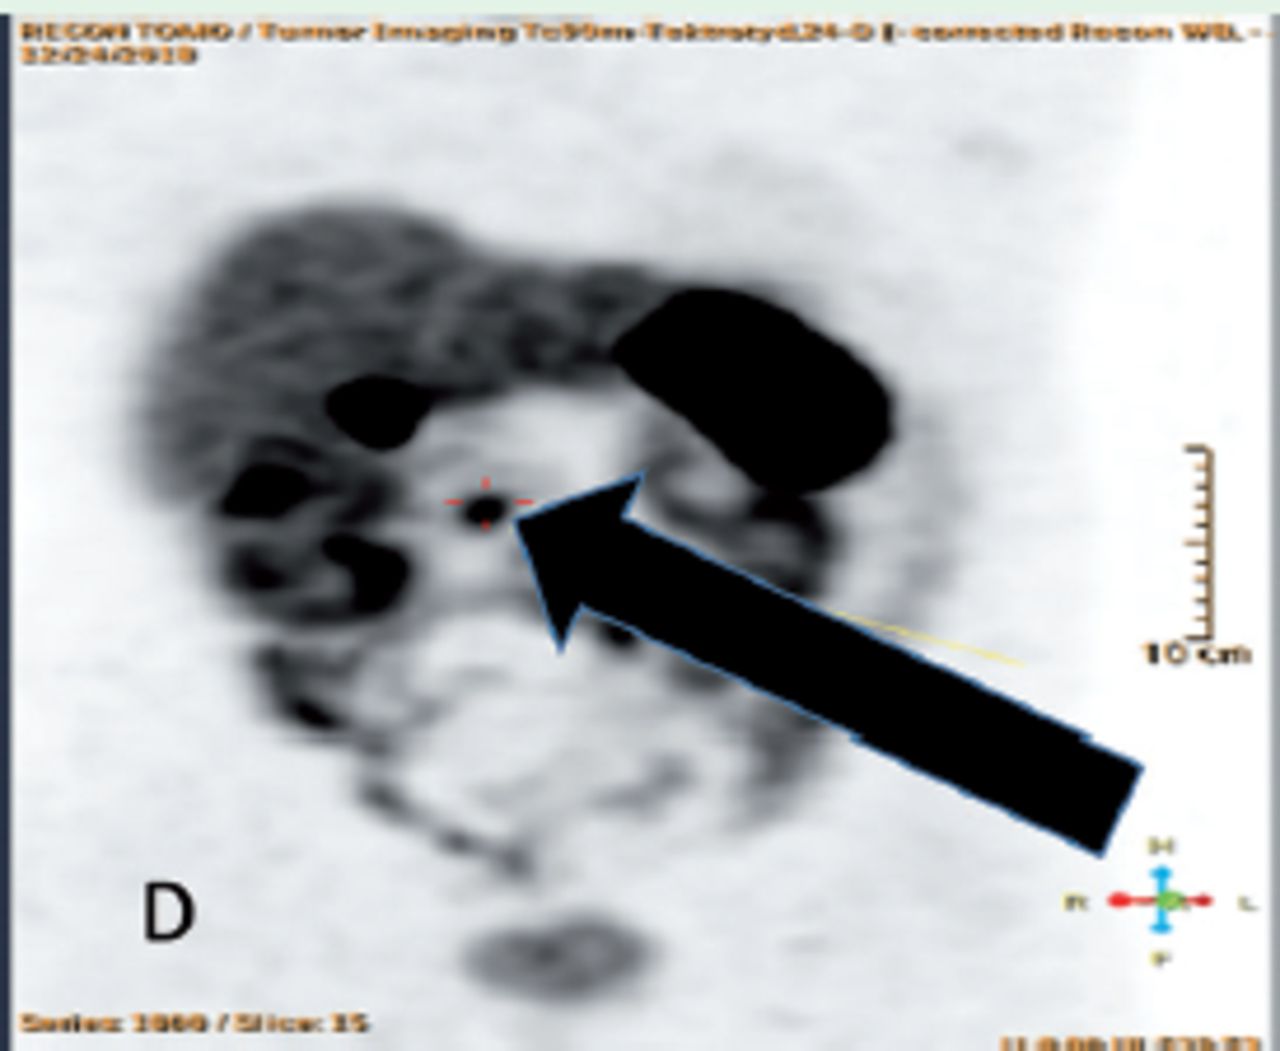
Maximum intensity projection (MIP) image, with arrow pointing to the head of pancreas, showing octreotide avid lesion
Tables
Variables Mean (SD) White blood cell (10^9/l) 7.89 (3.66) Hb (g/dl) 12.06 (2.38) Platelets 318.51 (134.66) Lymphocytes (10^9/l) 3.30 (1.96) Neutrophils (10^9/l) 3.81(3.17) C-reactive protein (mg/l) 49.81 (24.44) Ferritin (ng/ml) 284.02 (199.47) Lactate dehydrogenase (U/L) 323.96 (131.34) Partial thromboplastin time sec 36.67 (8.08) INR 1.057 (0.11) Vitamin D (nmol/l) 55.84(31.55) *D-dimer (ug/ml) 0.4 (0.30- 1.37) *Procalcitonin (ng/ml) 0.08 (0.04- 0.30) *Data are presented as Median (25th -75th interquartile range) Laboratory findings of the studied population (N=83)
In this issue


Jump to section
Related Articles
Cited By...
- No citing articles found.