


Article Figures & Data
Figures
Heatmap analysis displaying the overlapped targets which were dis-regulated under tuberculosis infections among the Gene expression Omnibus public datasets GSE20050 (clinic), GSE57275 (in vivo), and GSE52819 (cultured cells based.
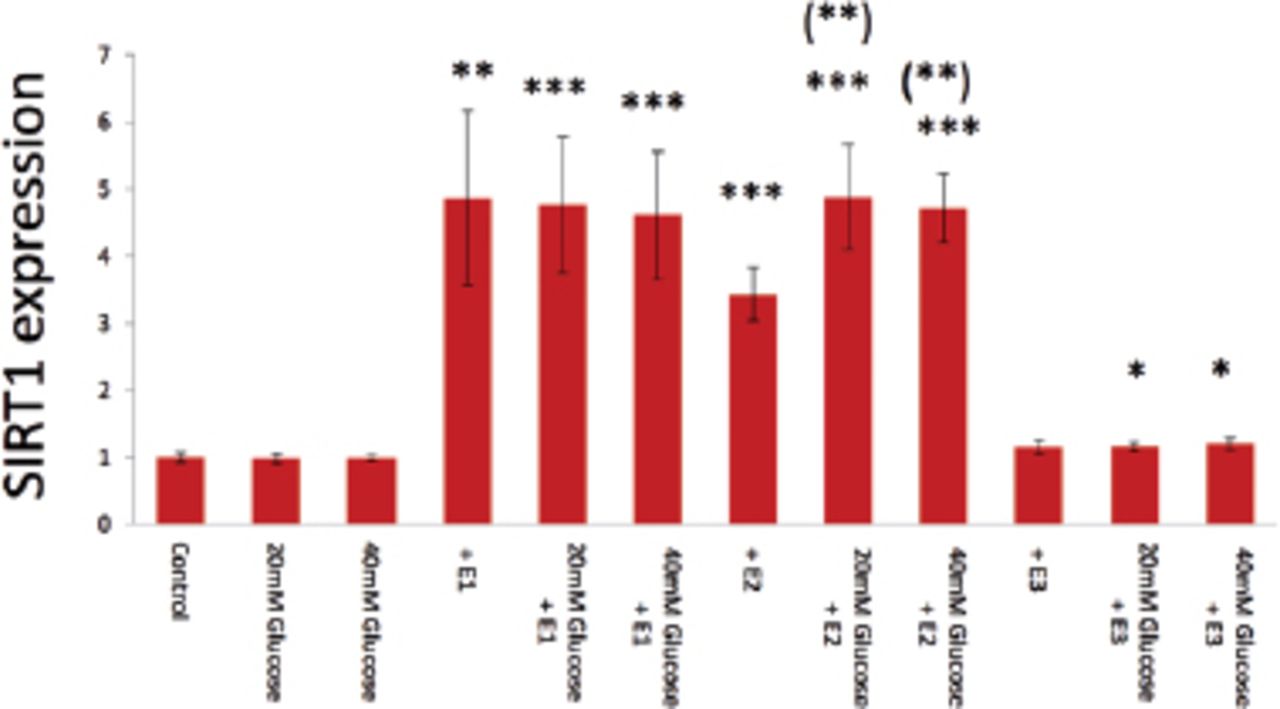
Glucose (20-40 mM) inhibition of E1-, E2-, and E3-induced SIRT1 expression in real-time PCR analysis.
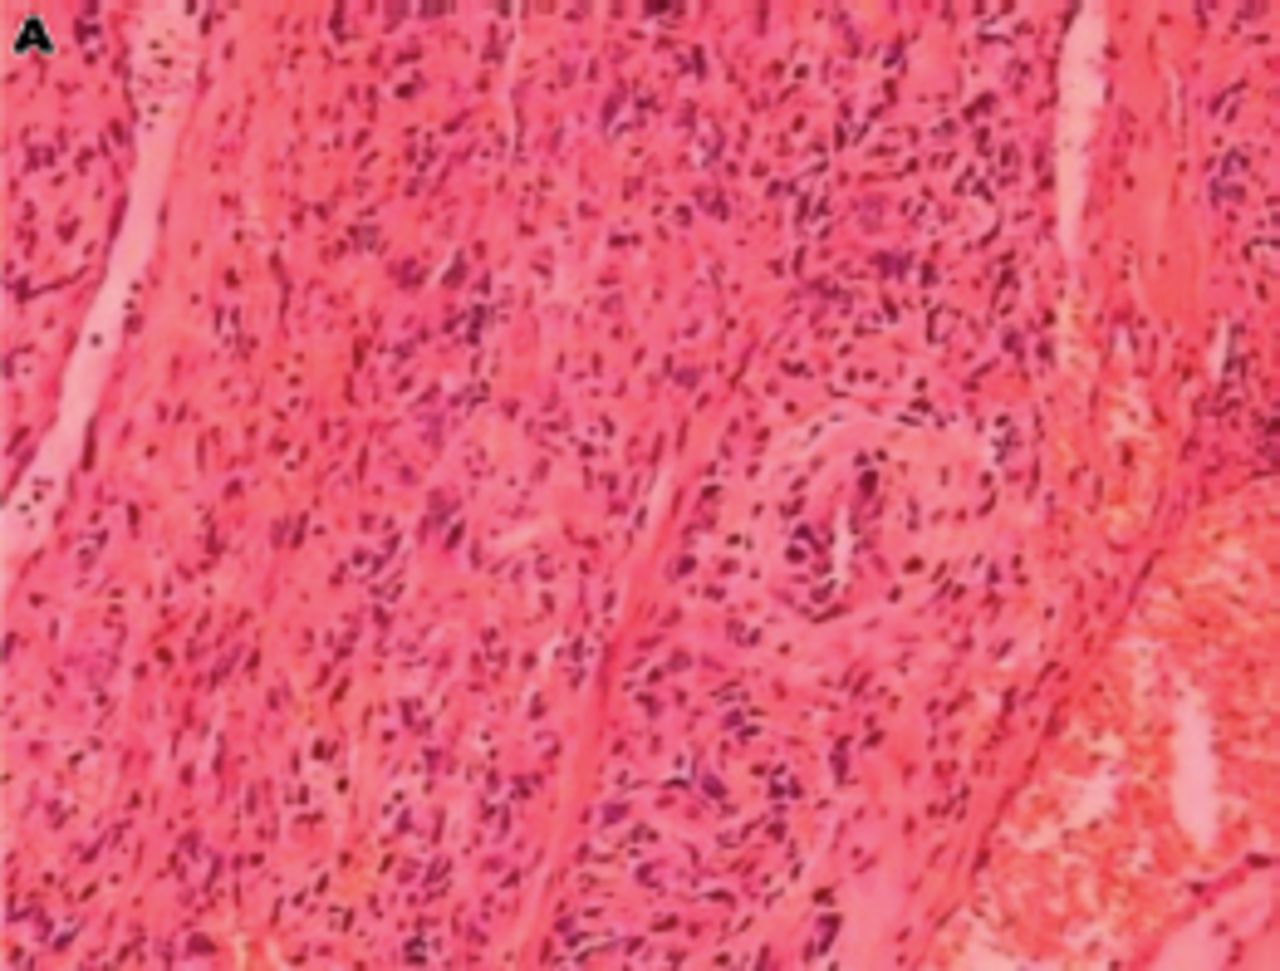
Tumor was composed of atypia ber-like spindle cells, HE×100.


In this issue


Jump to section
Related Articles
Cited By...
- No citing articles found.