


Article Figures & Data
Figures
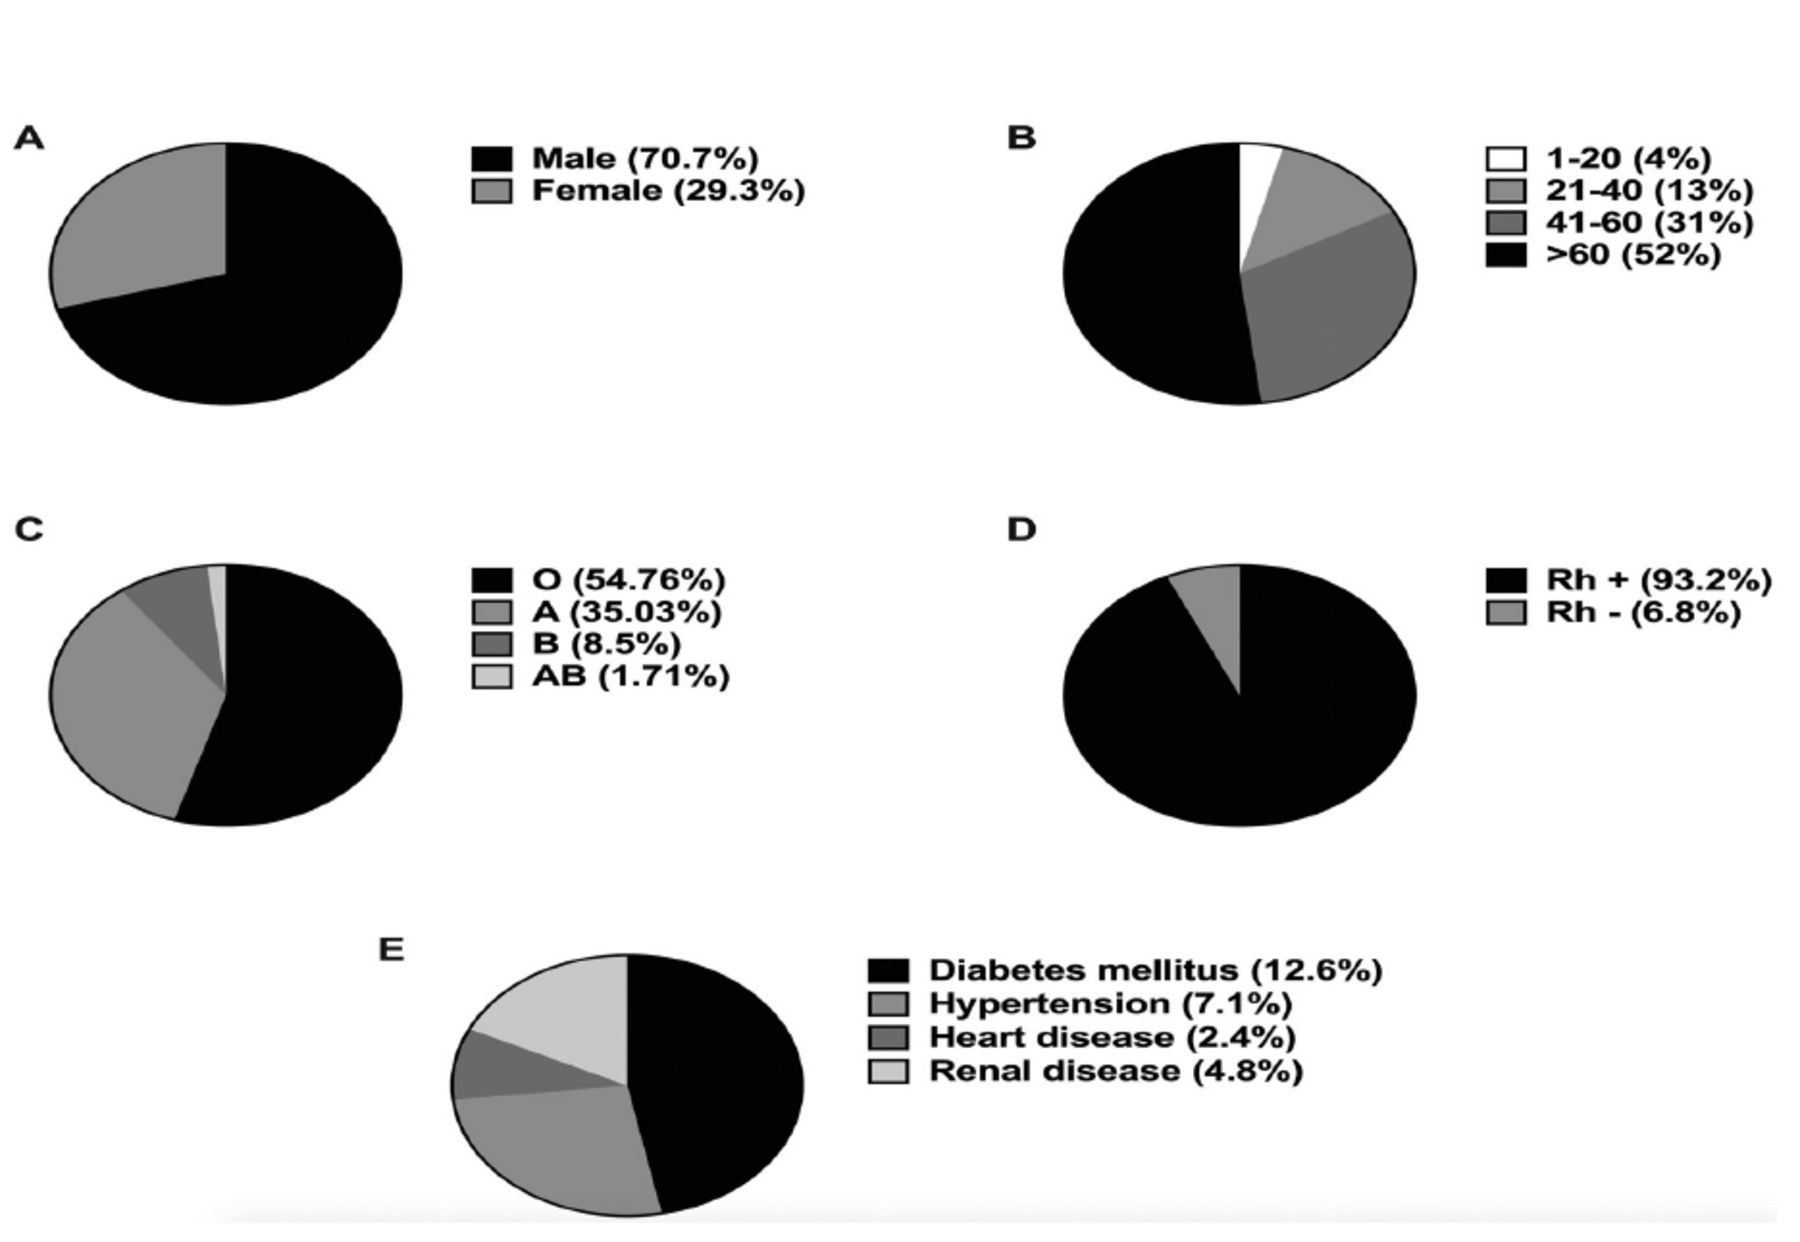
- Figure 1
- Demographic and clinical characteristics of coronavirus disease-19 (COVID-19) patients. A) Pie chart showing gender distribution of COVID-19 patients. B) Pie chart showing age distribution of COVID-19 patients. C) Pie chart showing ABO blood group distribution of COVID-19 patients. D) Pie chart showing Rh blood group distribution of COVID-19 patients. E) Pie chart showing distribution of comorbidities among COVID-19 patients.
- Figure 2
- Column bar graphs comparing ferritin, glucose, urea, and creatinine among COVID-19 positive patients. A) Column bar graph comparing ferritin, glucose, urea, and creatinine among non-intensive care unit (ICU)- and ICU-admitted coronavirus disease-19 (COVID-19)-positive patients. The mean ferritin was 1165±636.9 vs. 867.7±642.4 (p=0.004), glucose was 192.5±81.27 vs. 178.2±95.05 (p=0.17), urea was 119.3±92.07 vs. 67.75±66.77 (p=0.0001), and creatinine was 2.020±18.12 vs. 1.560±2.021 (p=0.042) in ICU-admitted versus non-ICU patients. B) Column bar graph comparing ferritin, glucose, urea, and creatinine among non-survivor and survivor COVID-19-positive patients. The mean values of these markers in non-survivors and survivors were: 1141±673.2 vs. 897.6±619.1 (p=0.021) for ferritin, 211.9±86.21 vs. 162.5±85.29 (p=0.0001) for glucose, 141.7±92.20 vs. 50.51±44.35 (p=0.0001) for urea, and 2.502±1.994 vs. 1.174±1.669 (p=0.0001) for creatinine. P-values were calculated with the unpaired Student’s T-test. *P<0.05, **p<0.01, ***p<0.001, ****p<0.0001, ns: non-significant
- Figure 3
- Receiver operating characteristic (ROC) curve analysis of age, ferritin, glucose, urea, and creatinine across coronavirus disease-19 (COVID-19)-positive patients. A) Intensive care unit (ICU) admission is considered a positive actual state. Receiver operating characteristic curve analysis in non-ICU-admitted vs. ICU-admitted gave the area under the curve (AUC) values of 0.536 for age (p=0.283), 0.637 for ferritin (p=0.003), 0.573 for glucose (p=0.029), 0.703 for urea (p<0.0001), and 0.657 for creatinine (p<0.0001). B) Non-survivor is considered a positive actual state. Receiver operating characteristic curve analysis in survivors vs. non-survivors gave AUC values of 0.685 for age (p<0.0001), 0.610 for ferritin (p=0.0187), 0.681 for glucose (p<0.0001), 0.856 for urea (p<0.0001), and 0.823 for creatine (p<0.0001).


Tables
- Table 1
- Comparison of demographics, clinical characteristics, and blood group between non-intensive care unit-admitted and intensive care unit-admitted coronavirus disease-19 patients.
Variables ICU admitted P-values No Yes Gender Male 108 (68.8) ----- 100 (73.0) ----- 0.42† Female 49 (31.2) ----- 37 (27.0) ----- Age (year) All 157 (53.4) 58.24±19.37 137 (46.6) 60.51±17.44 0.30* 1-20 6 (3.8) 14.5±6.9 5 (3.6) 11.60±8.50 0.54* 21-40 24 (15.3) 33.80±5.25 14 (10.2) 34.00±5.71 0.90* 41-60 49 (31.2) 49.19±6.22 43(31.4) 53.84±4.51 0.0002* >60 78 (49.7) 74.51±9.17 75 (54.7) 72.55±8.38 0.17* Blood groups O 84 (53.5) ----- 77 (56.2) ----- 0.89† A 55 (35.0) ----- 48 (35.0) ----- B 15 (9.5) ----- 10 (7.3) ----- AB 3 (2) ----- 2 (1.5) ----- Rh Rh + 148 (94.3) ----- 126 (92.0) ----- 0.43† Rh - 9 (5.7) ----- 11 (8.0) ----- Comorbidities Diabetes mellitus 17 (46.0) ----- 20 (54.0) ----- 0.39† Hypertension 14 (66.7) ----- 7 (33.3) ----- 0.31† Heart disease 4 (57.2) ----- 3 (42.8) ----- 0.89† Renal disease 8 (57.2) ----- 6 (42.8) ----- 0.85† - Table 2
- Comparison of demographics, clinical characteristics, and blood group between non-survivor and survivor coronavirus disease-19 patients.
Variables Mortality P-values No Yes Gender Male 116 (55.8) ----- 92 (44.2) ----- 0.58† Female 45 (52.3) ----- 41 (47.7) ----- Age (year) All 161 (54.8) 53.96±19.55 133 (45.2) 65.77±15.77 0.0001* 1-20 9 (5.6) 13.50±7.03 2 (1.5) 8.50±10.61 0.42* 21-40 34 (21.1) 34.24±5.07 4 (3.0) 30.75±7.50 0.22* 41-60 56 (34.8) 50.02±5.91 36 (27.1) 53.56±5.34 0.004* >60 62 (38.5) 74.10±8.60 91 (68.4) 73.40±9.27 0.63* Blood groups O 86 (53.4) ----- 75 (56.4) ----- 0.69† A 57 (35.4) ----- 46 (34.6) ----- B 14 (8.7) ----- 11 (8.3) ----- AB 4 (2.5) ----- 1 (0.7) ----- 0.17† Rh + 153 (55.8) ----- 121 (44.2) ----- Rh - 8 (40.0) ----- 12 (60.0) ----- Comorbidities Diabetes mellitus 17 (45.9) ----- 20 (54.0) ----- 0.59† Hypertension 12 (57.1) ----- 9 (42.9) ----- 0.32† Heart disease 3 (42.9) ----- 4 (57.1) ----- 0.87† Renal disease 5 (35.7) ----- 9 (64.3) ----- 0.54† - Table 3
- Association of gender, age, ferritin, glucose, urea, and creatinine with intensive care unit admission and mortality among coronavirus disease-19 patients.
Variable ICU-admission Mortality P-values P-values Gender 0.815 (0.489-1.350) 0.4297 1.174 (0.707-1.946) 0.5327 Age 0.993 (0.981-1.006) 0.2994 0.963 (0.948-0.976) 0.0001 Ferritin 0.999 (0.998-0.999) 0.0055 0.999 (0.998-0.999) 0.0149 Glucose 0.995 (0.998-1.001) 0.1716 0.993 (0.990-0.996) 0.0001 Urea 0.991 (0.987-0.994) 0.0001 0.976 (0.970-0.982) 0.0001 Creatinine 0.877 (0.763-0.993) 0.0502 0.556 (0.442-0.682) 0.0001 Values are presented as odds ratio (OR) 95% confidence interval, ICU: intensive care unit


