


Article Figures & Data
Figures
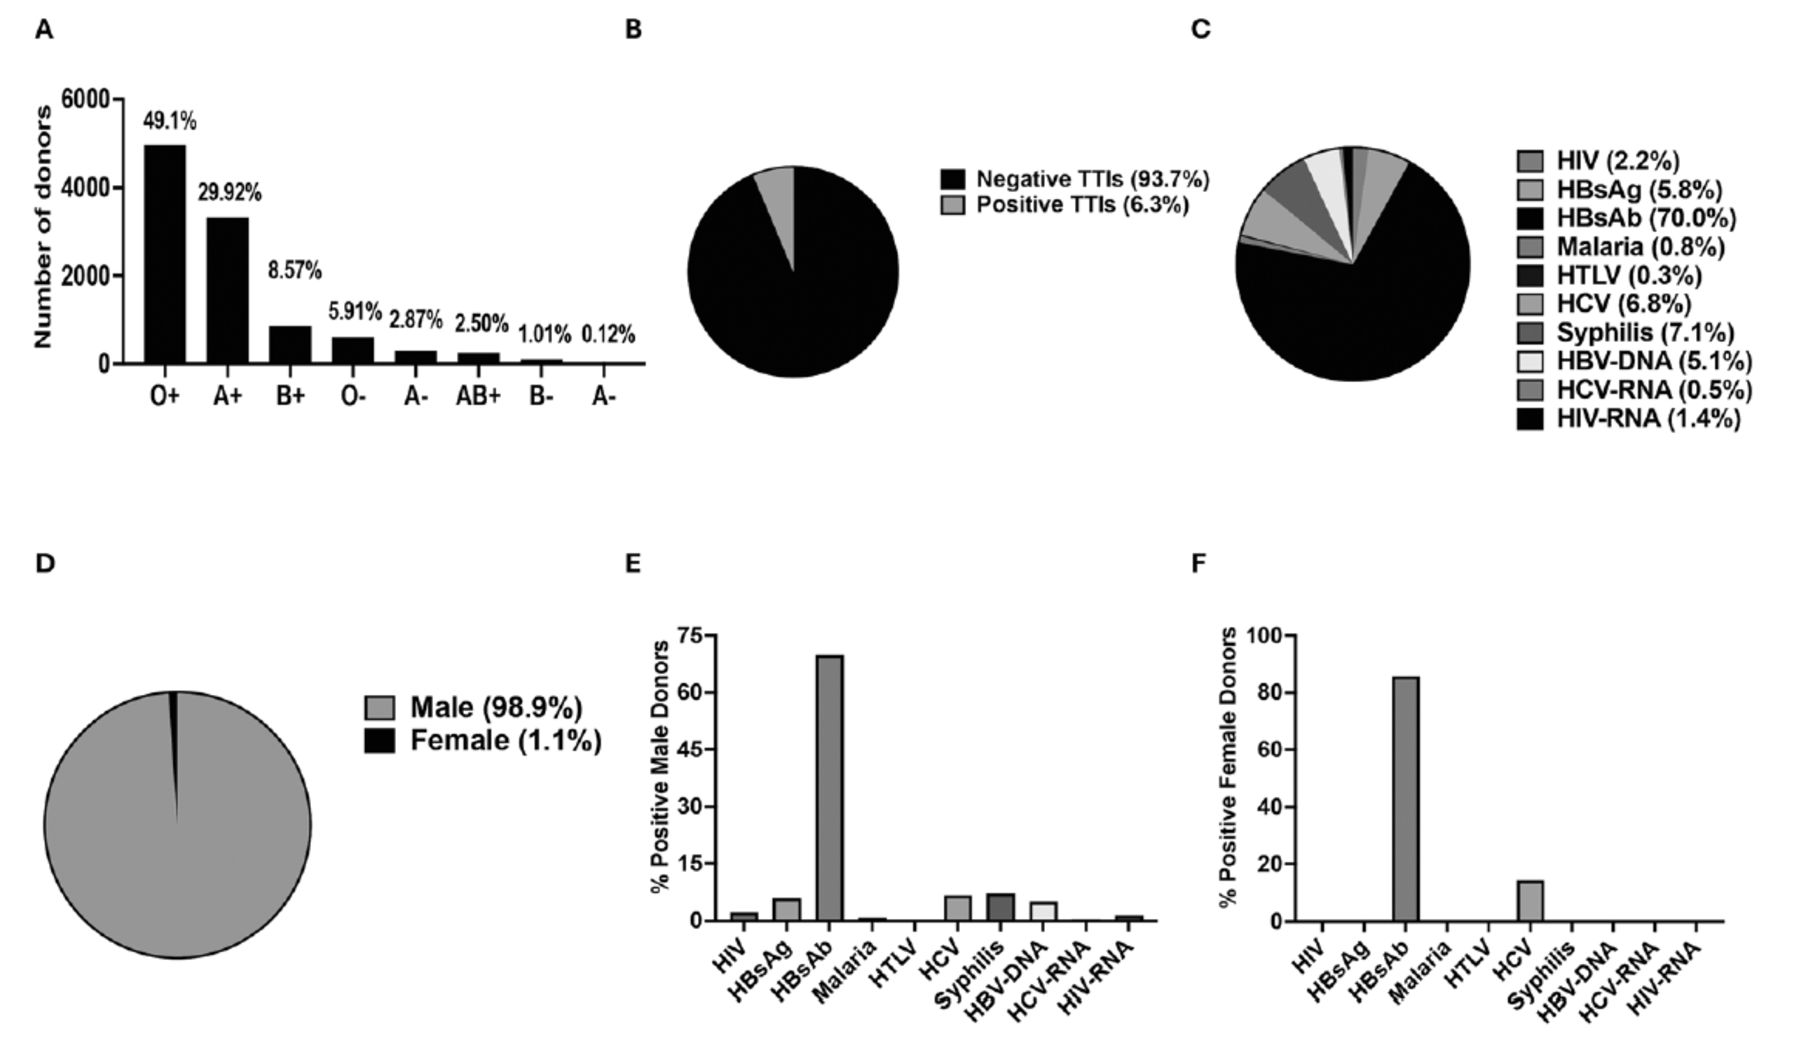
- Figure 1
- Graphs showing blood group distribution, the prevalence of transfusion-transmitted infections (TTIs) and gender among donors. A) Column graph showing ABO/Rh-D blood group distribution among donors. B) Pie chart showing the percentage of confirmed cases among biomarker-reactive donors. C) Pie chart showing the prevalence of TTIs among all positive donors. D) Pie chart showing gender distribution of total TTI positive donors. E) Column graph showing the prevalence of TTIs among positive male donors. F) Column graph showing the prevalence of TTIs among positive female donors. HIV: human immunodeficiency virus, HBsAg: hepatitis B surface antigen, HBcAb: hepatitis B core antibody, HTLV: human T-lymphotropic virus, HCV: hepatitis C virus, HBV-DNA: hepatitis B virus-deoxyribonucleic acid, HCV-RNA: hepatitis C virus-ribonucleic acid, HIV-RNA: human immunodeficiency virus-ribonucleic acid

Tables
Personal data n (%) Age in years, mean±SD (range) 33.5±9.1 (18-65) Gender Male 10,021 (99.3) Female 74 (0.7) ABO A 3311 (32.8) B 967 (9.6) AB 264 (2.6) O 5553 (55.0) Rh Negative 998 (9.9) Positive 9097 (90.1) Kell Negative 946 (92.2) Positive 80 (7.8) Values are presented as numbers and precentages (%) or mean ± standard deviation (SD).
- Table 2
- Distribution of transfusion-transmissible infection markers among blood donors according to ABO blood type.
Markers A B AB O P-values HIV Positive 9 (0.3) 0 (0.0) 0 (0.0) 5 (0.1) 0.137* Negative 3302 (99.7) 967 (100) 264 (100) 5548 (99.9) HBsAg Positive 13 (0.4) 4 (0.4) 5 (1.9) 15 (0.3) X2=18.40 Negative 3298 (99.6) 963 (99.6) 259 (98.1) 5538 (99.8) 0.0004** HBcAb Positive 142 (4.3) 52 (5.4) 11 (4.2) 238 (4.3) X2=2.503 Negative 3169 (95.7) 915 (94.6) 253 (95.8) 5315 (95.7) 0.47** Malaria Positive 4 (0.1) 0 (0.0) 0 (0.0) 1 (0.0) 0.23* Negative 3307 (100) 967 (100) 264 (100) 5552 (100) HTLV Positive 2 (0.1) 0 (0.0) 0 (0.0) 0 (0.0) 0.33* Negative 3309 (99.9) 967 (100) 264 (100) 5553 (100) HCV Positive 16 (0.5) 5 (0.5) 1 (0.4) 21 (0.4) X2=0.7582 Negative 3295 (99.5) 962 (99.5) 263 (99.6) 5532 (99.7) 0.85** Syphilis Positive 19 (0.6) 4 (0.4) 0 (0.0) 22 (0.4) 0.54* Negative 3292 (99.4) 963 (99.6) 264 (100) 5531 (99.6) HBV Positive 11 (0.3) 3 (0.3) 4 (1.5) 14 (0.3) X2=12.76 Negative 3300 (9.7) 964 (99.7) 260 (98.5) 5539 (99.7) 0.005** HCV Positive 0 (0.0) 1 (0.1) 0 (0.0) 2 (0.0) 0.25* Negative 3311 (100) 966 (99.9) 264 (100) 5551 (99.9) HIV Positive 5 (0.1) 0 (0.0) 0 (0.0) 4 (0.1) 0.56* Negative 3306 (99.8) 967 (100) 264 (100) 5549 (99.9) Values are presented as numbers and percentages (%).
HIV: human immunodeficiency virus, HBsAg: hepatitis B surface antigen, HBcAb: hepatitis B core antibody, HTLV: human T-lymphotropic virus, HCV: hepatitis C virus, HBV: hepatitis B virus, NAT: nucleic acid test
- Table 3
- Pairwise comparisons of blood groups based on presence and absence of transfusion-transmissible infection markers.
Markers Blood group A Blood group B Blood group AB Blood group O A Other groups B Other groups AB Other groups O Other groups HIV Positive 9 (0.3) 5 (0.1) 0 (0.0) 14 (0.2) 0 (0.0) 14 (0.1) 5 (0.1) 9 (0.2) Negative 3302 6779 967 9114 264 9817 5548 4533 P-value X2=6.30, p=0.01** p=0.38* p=0.99* X2=2.10, p=0.14** HBsAg Positive 13 (0.4) 24 (0.4) 4 (0.4) 33 (0.4) 5 (1.9) 32 (0.3) 15 (0.3) 22 (0.5) Negative 3298 6760 963 9095 259 9799 5538 4520 P-value X2=0.092, p=0.76** X2=0.065, p=0.79** X2=17.319, p=0.00003** X2=3.140, p =0.07** HBsAb Positive 142 (4.3) 301 (4.4) 52 (5.4) 391 (4.3) 11 (4.2) 432 (4.4) 238 (4.3) 205 (4.5) Negative 3169 6483 915 8737 253 9399 5315 4337 P-value X2=0.178, p=0.67** X2=2.493, p=0.11** X2=0.031, p=0.85** X2=0.308, p=0.57** Malaria Positive 4 (0.1) 1 (0.0) 0 (0.0) 5 (0.1) 0 (0.0) 5 (0.1) 1 (0.0) 4 (0.1) Negative 3307 6783 967 9123 264 9826 5552 4538 P-value X2=5.056, p=0.02** p=0.99* p=0.99* X2=2.477, p=0.11** HTLV Positive 2 (0.1) 0 (0.0) 0 (0.0) 2 (0.02) 0 (0.0) 2 (0.02) 0 (0.0) 2 (0.04) Negative 3309 6784 967 9126 264 9829 5553 4540 P-value p=0.10* p=0.99* p=0.99* p=0.20* HCV Positive 16 (0.5) 27 (0.4) 5 (0.5) 38 (0.4) 1(0.4) 42 (0.4) 21 (0.4) 22 (0.5) Negative 3295 6757 962 9090 263 9789 5532 4520 P-value X2=0.381, p=0.53** X2=0.209, p=0.64** X2=0.014, p=0.90** X2=0.664, p=0.41** Syphilis Positive 19 (0.6) 26 (0.4) 4 (0.4) 41(0.4) 0 (0.0) 45 (0.5) 22 (0.4) 23 (0.5) Negative 3292 6758 963 9087 264 9786 5531 4519 P-value X2=0.664, p=0.41** X2=0.024, p=0.87** p=0.63* X2=0.683, p=0.40** HBV Positive 11 (0.3) 21 (0.3) 3 (0.3) 29 (0.3) 4 (1.5) 28 (0.3) 14 (0.3) 18 (0.4) Negative 3300 6763 964 9099 260 9803 5539 4524 P-value X2=0.036, p=0.84** X2=0.001, p=0.96** X2=12.316, p=0.0004** X2=1.643, p=0.19** HCV Positive 0 (0.0) 3 (0.0) 1 (0.1) 2 (0.0) 0 (0.0) 3 (0.0) 2 (0.0) 1 (0.0) Negative 3311 6781 966 9126 264 9828 5551 4541 P-value p=0.55* X2=1.955, p=0.16** p=0.99* X2=0.164, p=0.68** HIV Positive 5 (0.2) 4 (0.1) 0 (0.0) 9 (0.1) 0 (0.0) 9 (0.1) 4 (0.1) 5 (0.1) Negative 3306 6780 967 9119 264 9822 5549 4537 P-value X2=2.116, p=0.14** p=0.99* p=0.99* X2=0.406, p=0.52** Values are presented as numbers and percentages (%).χ2 is the Chi-square statistic.
Serological test results for human immunodeficiency virus (HIV), hepatitis B surface antigen (HBsAg), hepatitis B core antibody (HBcAb), malaria, human T-lymphotropic virus (HTLV), hepatitis C virus (HCV), and syphilis. Nucleic acid test (NAT) results for hepatitis B virus (HBV), HCV, and HIV.
- Table 4
- Distribution of transfusion-transmissible infection markers among blood donors according to Rh-D blood type.
Markers Rh-D positive Rh-D negative P-values HIV Positive 13 (0.1) 1 (0.1) X2=0.1184, p=0.73** Negative 9084 (99.9) 997 (99.9) HBsAg Positive 36 (0.4) 1 (0.1) X2=2.151, p=0.14** Negative 9061 (99.6) 997 (99.9) HBcAb Positive 408 (4.5) 35 (3.5) X2=2.050, p=0.15** Negative 8689 (95.5) 963 (96.5) Malaria Positive 5 (0.05) 0 (0.0) p=0.99* Negative 9092 (99.9) 998 (100) HTLV Positive 0 (0.0) 2 (0.2) p=0.009* Negative 9097 (100) 996 (99.8) HCV Positive 39 (0.4) 4 (0.4) X2=0.01652, p=0.89** Negative 9058 (99.6) 994 (99.6) Syphilis Positive 39 (0.4) 6 (0.6) X2=0.6030, p=0.438** Negative 9058 (99.6) 962 (99.4) HBV Positive 31 (0.34) 1 (0.1) X2=1.647, p=0.19** Negative 9066 (99.7) 997 (99.9) HCV Positive 3 (0.03) 0 (0.0) p=0.99* Negative 9095 (99.97) 998 (100) HIV Positive 8 (0.1) 1 (0.1) X2=0.01517, p=0.90** Negative 9089 (99.9) 997 (99.9) Values are presented as numbers and percentages (%). χ2 is the Chi-square statistic.
Serological test results for human immunodeficiency virus (HIV), hepatitis B surface antigen (HBsAg), hepatitis B core antibody (HBcAb), malaria, human T-lymphotropic virus (HTLV), hepatitis C virus (HCV), and syphilis. Nucleic acid test (NAT) results for hepatitis B virus (HBV), HCV, and HIV.
- Table 5
- Distribution of transfusion-transmissible infection markers among blood donors according to Kell blood type.
Markers Kell positive Kell negative P-values HIV Negative 78 (97.5) 945 (99.9) X2=14.5, p=0.0001** Positive 2 (2.5) 1 (0.1) HBsAg Negative 79 (98.7) 929 (98.2) X2=0.1281, p=0.720 Positive 1 (1.3) 17 (1.8) HBcAb Negative 64 (80.0) 929 (98.2) X2=78.51, p<0.0001** Positive 16 (20.0) 17 (1.8) Malaria Negative 80 (100) 946 (100) p=0.99* Positive 0 (0.0) 0 (0.0) HTLV Negative 80 (100) 946 (100) p=0.99* Positive 0 (0.0) 0 (0.0) HCV Negative 80 (100) 946 (100) p=0.99* Positive 0 (0.0) 0 (0.0) Syphilis Negative 77 (96.2) 945 (99.9) X2=25.225, p=<0.00001** Positive 3 (3.8) 1 (0.1) HBV Negative 79 (98.7) 929 (98.2) X2=0.1281, p=0.72** Positive 1 (1.3) 17 (1.8) HCV Negative 80 (100) 944 (99.8) p=0.99* Positive 0 (0.0) 2 (0.21) HIV Negative 79 (98.7) 944 (99.8) X2=2.729, p=0.09** Positive 1 (1.3) 2 (0.21) Values are presented as numbers and percentages (%).χ2 is the Chi-square statistic.
Serological test results for human immunodeficiency virus (HIV), hepatitis B surface antigen (HBsAg), hepatitis B core antibody (HBcAb), malaria, human T-lymphotropic virus (HTLV), hepatitis C virus (HCV), and syphilis. Nucleic acid test (NAT) results for hepatitis B virus (HBV), HCV, and HIV.


